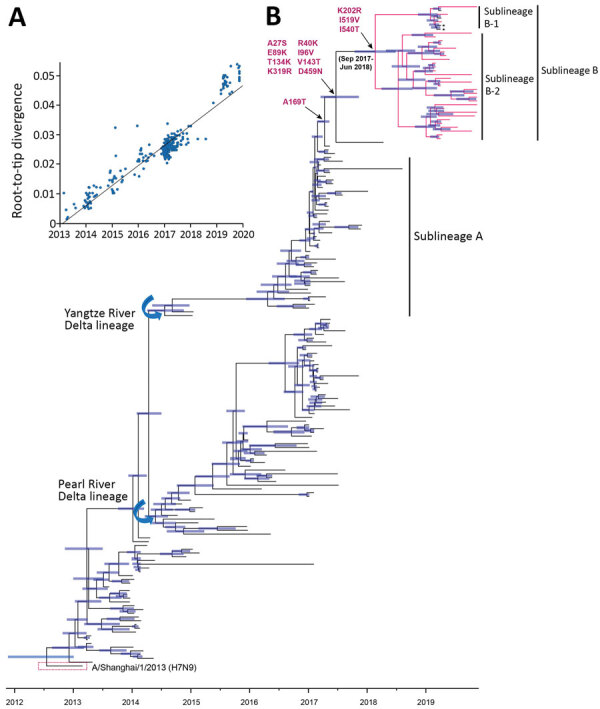
Figure 2.

Time-scaled evolution of influenza A(H7N9) viruses, China. A) Analysis of root-to-tip divergence against sampling date for the hemagglutinin gene segment (n = 189). B) Maximum clade credibility tree of the hemagglutinin sequence of H7N9 viruses sampled in China (n = 189); the H7N9 viruses collected in this study are highlighted in red. Asterisk indicates viruses from a human with H7N9 infection within sublineage B during March 2019. Shaded bars represent the 95% highest probability distribution for the age of each node. Parallel amino acid changes along the trunk are indicated.
