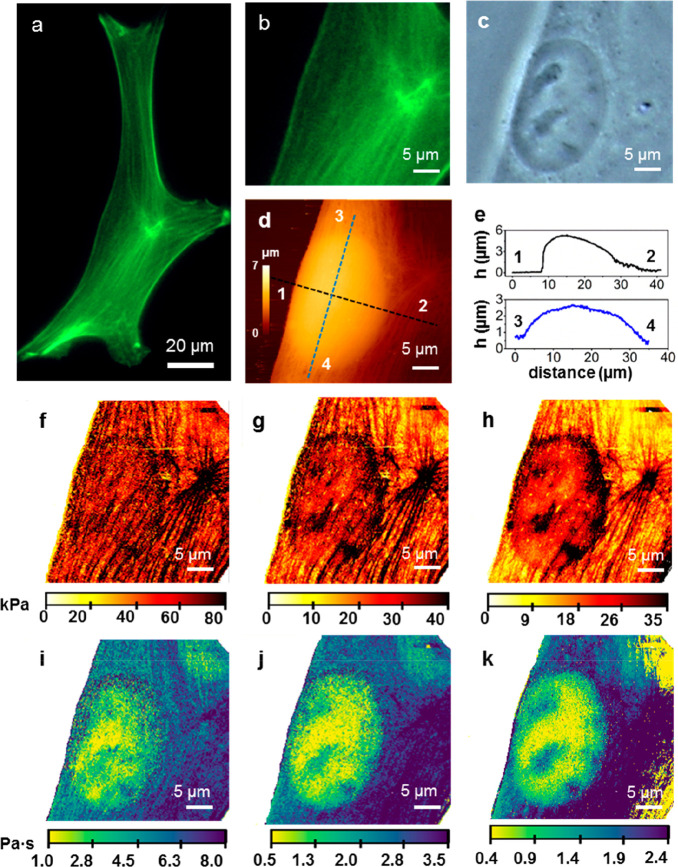
Figure 2.
(a) Fluorescence microscope image of the actin cytoskeleton of a NIH-3T3 fibroblast. (b) Zoomed-in image from (a) according to the AFM scan area. (c) Optical phase contrast image of the region shown in (b). (d) AFM image of the region shown in panels (b,c). (e) Height cross sections along the dashed line marked in (d). (f–h) Stiffness panels extracted at different indentation ranges. (i–k) Nucleus and some organelles are visualized. To record the AFM images, a triangular waveform movement was applied to the cantilever. Each FDC was characterized by a constant tip velocity of 250 μm/s and maximum force of 4 nN (see more details in Materials and Methods).

