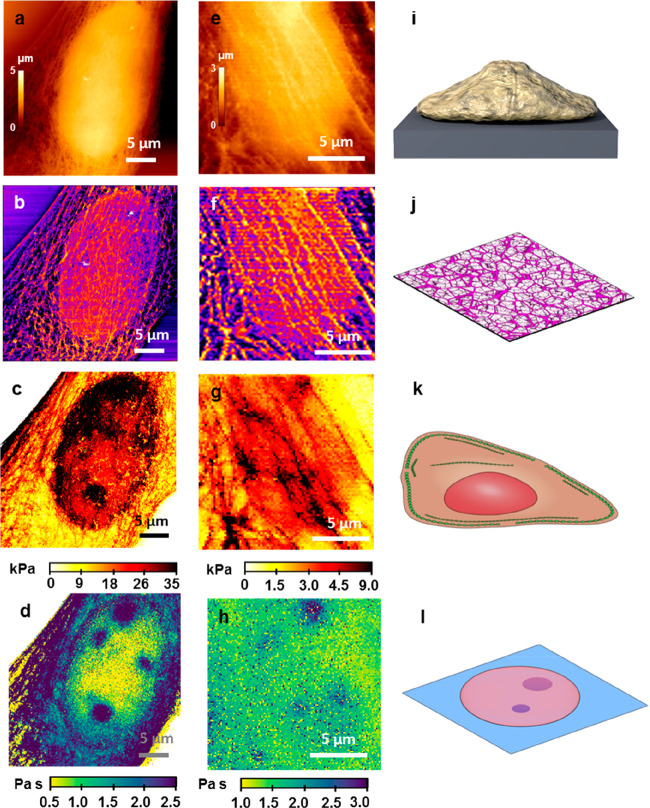
Figure 5.
AFM tomographic sections of live and fixed NIH-3T3 fibroblast cells. (a) Topography of the cell surface (fixed); cell depth = 0 nm. (b) Topography of the actin cytoskeleton; cell depth = 0–100 nm. (c) Young’s modulus image; cell depth z = 500 nm. (d) Viscous coefficient map; cell depth = 1000 nm. (e) Surface topography of a live cell; cell depth = 0 nm. (f) Topography of the actin cytoskeleton; cell depth = 0–100 nm.(g) Young’s modulus image; cell depth = 500 nm. (h) Viscous coefficient map; cell depth = 1000 nm. (i) Scheme of an AFM topography image taken on a single cell. (j) Scheme of the actin based cell cortex. (k) Scheme of some of the cell elements that dominate the cell stiffness. (l) Scheme of some cell organelles immersed in the nucleosol.

