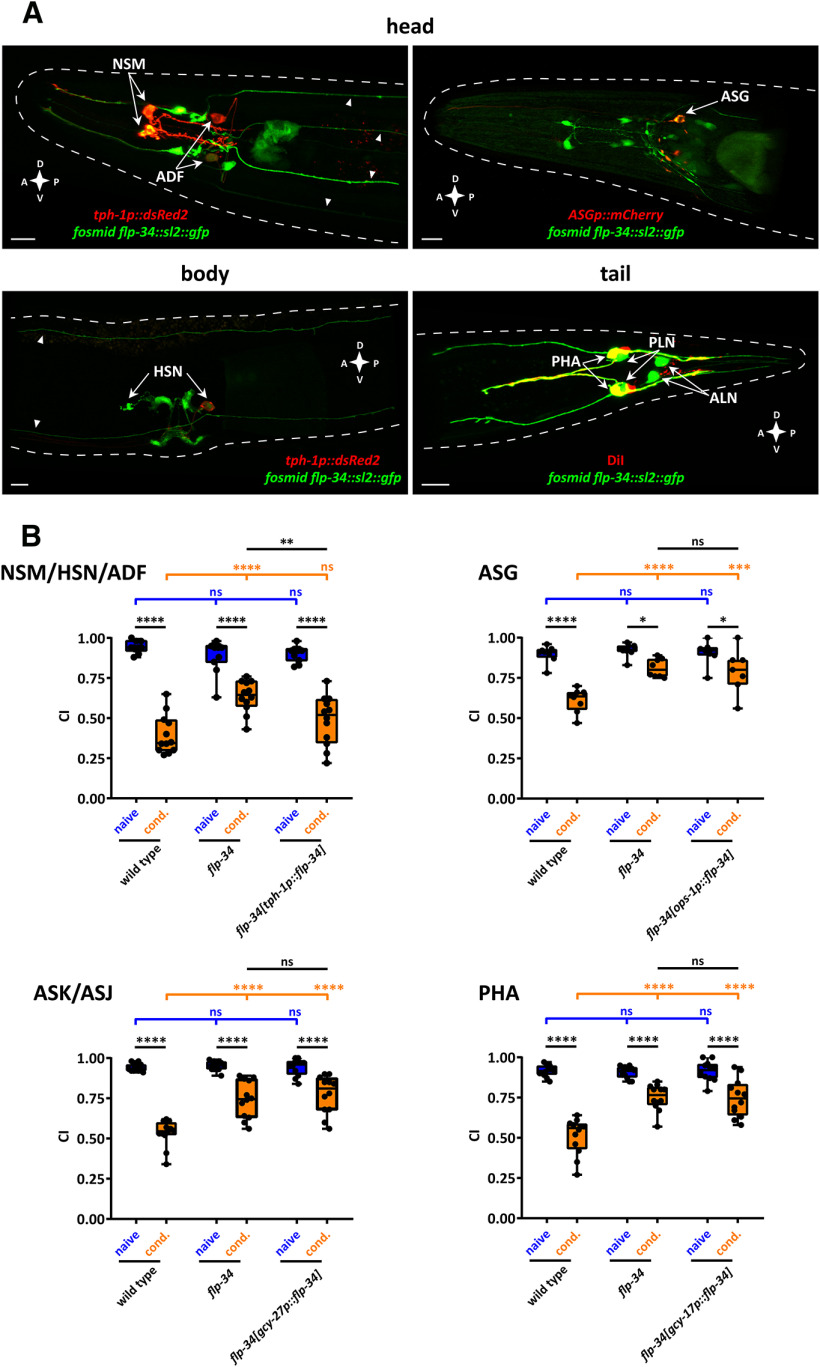
Figure 7.
flp-34 is required in serotonergic neurons for diacetyl learning. A, Representative confocal z-stack projections of head, body, and tail neurons expressing a fosmid-based flp-34::sl2::gfp transgene in adult hermaphrodites. flp-34 expression in the serotonergic neurons NSM, ADF (head panel), and HSN (body panel) was identified by colocalization with a tph-1p::DsRed2 marker transgene. Arrowheads indicate head and body projections from tail neurons. flp-34 expression in ASG neurons (head panel) was identified by colocalization with nlp-44p::mCherry marker transgene. Expression of flp-34 in the tail neuron PHA was identified by colocalization with DiI staining, whereas ALN and PLN were determined by morphology and position (tail panel). A, Anterior; P, posterior; D, dorsal; V, ventral. Scale bars, 10 µm. B, flp-34 acts in serotonergic neurons to regulate diacetyl learning. Top left, Expressing WT copies of flp-34 under control of the tph-1 (NSM, HSN, ADF) promoter in serotonergic neurons partially rescues the learning defect of flp-34 mutant animals. The expression of flp-34 under control of ops-1 (ASG) (top right), gcy-27 (ASK, ASJ) (bottom left), and gcy-17 (PHA) (bottom right) promoters does not rescue the learning defect of flp-34 mutants. (NSM, HSN, ADF) Two-way ANOVA revealed a significant effect of genotypes (F(2,63) = 5.333, p = 0.0072), of behavioral treatments (F(1,63) = 267.4, p < 0.0001), and of interaction between genotypes and behavioral treatments (F(2,63) = 11.28, p < 0.0001). Data were analyzed by Sidak's and Tukey's post hoc test (n ≥ 11). (ASG) Two-way ANOVA revealed a significant effect of genotypes (F(2,40) = 9.418, p = 0.0004), of behavioral treatments (F(1,40) = 53.87, p < 0.0001), and of interaction between genotypes and behavioral treatments (F(2,40) = 6.521, p = 0.0035). Data were analyzed by Sidak's and Tukey's post hoc test (n = 8). (ASK, ASJ) Two-way ANOVA revealed a significant effect of genotypes (F(2,66) = 16.66, p < 0.0001), of behavioral treatments (F(1,66) = 194.3, p < 0.0001), and of interaction between genotypes and behavioral treatments (F(2,66) = 15.59, p < 0.0001). Data were analyzed by Sidak's and Tukey's post hoc test (n = 12). (PHA) Two-way ANOVA revealed a significant effect of genotypes (F(2,66) = 16.77, p < 0.0001), of behavioral treatments (F(1,66) = 161.6, p < 0.0001), and of interaction between genotypes and behavioral treatments (F(2,66) = 17.90, p < 0.0001). Data were analyzed by Sidak's and Tukey's post hoc test (n = 12). Boxplots represent 25th (lower boundary) and 75th (upper boundary) percentiles. The 50th percentile (line) indicates the median. Whiskers represent the minimum and maximum values. Black dots represent individual CIs. *p < 0.05, **p < 0.01, ***p < 0.001, ****p < 0.0001. ns, not significant.

