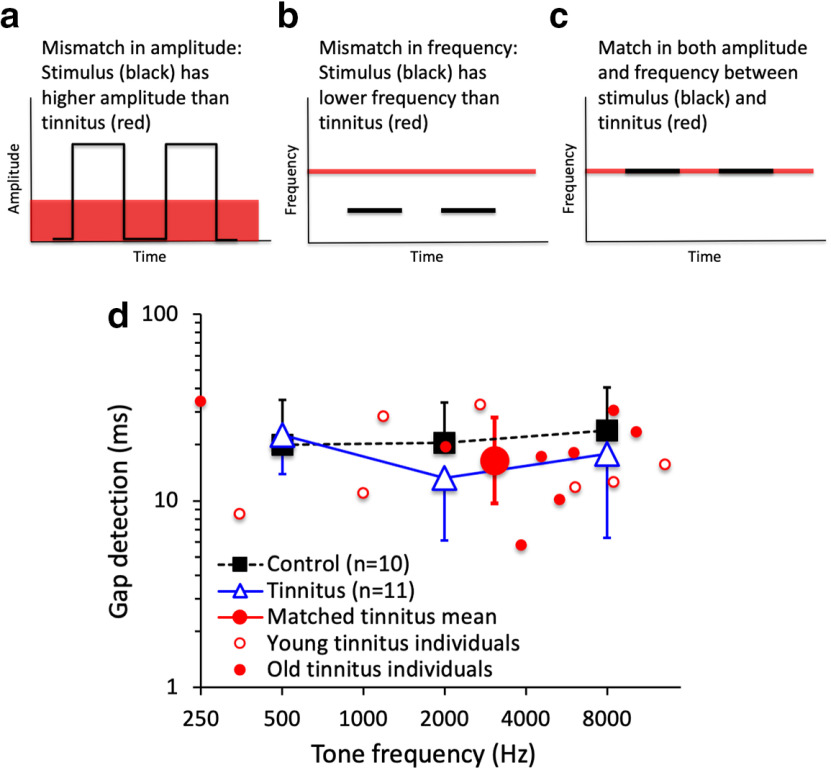
Figure 2.
Gap detection experimental design and data. a, Use of an amplitude cue for gap detection by presenting the gap stimuli at a comfortable loudness level (black), which is usually higher than the tinnitus loudness level (red). b, Use of a frequency cue for gap detection by using a pure tone, which has a lower frequency (black) than the tinnitus pitch (red). c, The present study minimized the amplitude and frequency cues by presenting the gap stimuli at the tinnitus-matched loudness level and pitch. d, Average gap detection threshold for pure-tone stimuli at 500, 2000, and 8000 Hz for 10 control subjects (solid black squares) and 11 tinnitus subjects (open blue triangles). Average gap detection threshold for tinnitus-matched stimuli (the large solid red circle with error bars) was the geometric mean for 11 tinnitus subjects, including 5 young subjects (small open red circles) and 6 old subjects (small solid red circles). There was no significant difference in gap detection at tinnitus-matched frequencies between the young and old tinnitus subjects (17 vs 15 ms; two-tailed, two-sample t test, p = 0.60). Four subjects matched their tinnitus pitches to two different frequencies, producing a total of 15 data points. Error bars show ±1 SD of the mean.

