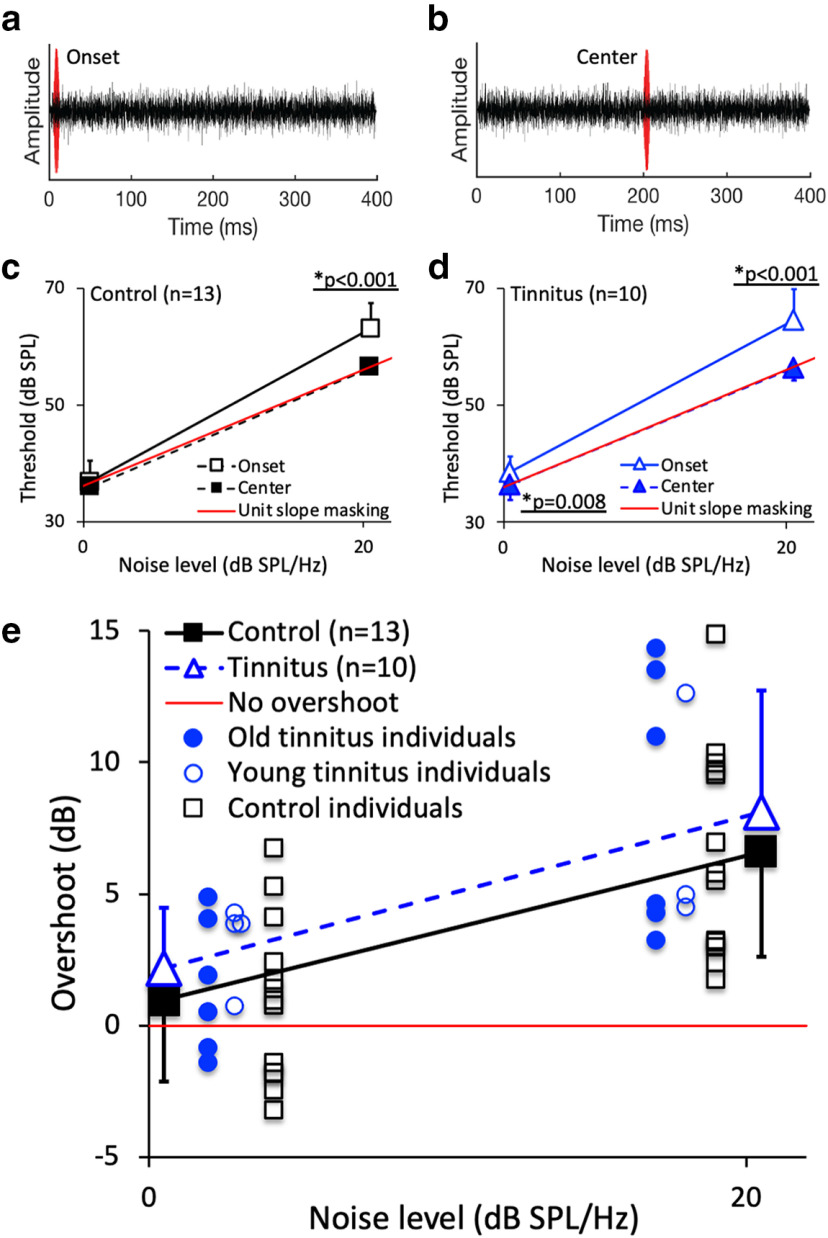
Figure 5.
Temporal masking and overshoot. a, Onset masking condition: detection of a 10 ms, 2000 Hz tone (red waveform) positioned at the onset of 400 ms broadband (100–10 000 Hz) white noise (black waveform). b, Center-masking condition: detection of the same signal positioned at the temporal center of the 400 ms noise. c, Masking growth functions for 13 control subjects. Detection threshold as a function of the noise level for the onset (open squares) and center (solid squares). The solid red line represents a slope of 1. The asterisk and the line below represent a significant difference between the groups at the 20 dB noise level. d, Masking growth functions for 10 tinnitus subjects. The symbols have the same meanings as those in c, except for the blue colors and triangles. The asterisk and the line below represent a significant difference between the groups at the 0 and 20 dB noise levels. e, Overshoot functions for the average tinnitus subjects (open blue triangles) and control subjects (solid black squares). Individual overshoot data include six old tinnitus subjects (solid blue circles), five young tinnitus subjects (open blue circles), and 13 control subjects (open black squares). The solid red line represents no overshoot, namely no difference in tone detection threshold between the onset and center conditions. Error bars show ±1 SD of the mean. There was no significant difference in overshoot between the old and young tinnitus subjects (solid vs open circles in e; p = 0.29 for 0 dB noise and p = 0.75 for 20 dB noise).

