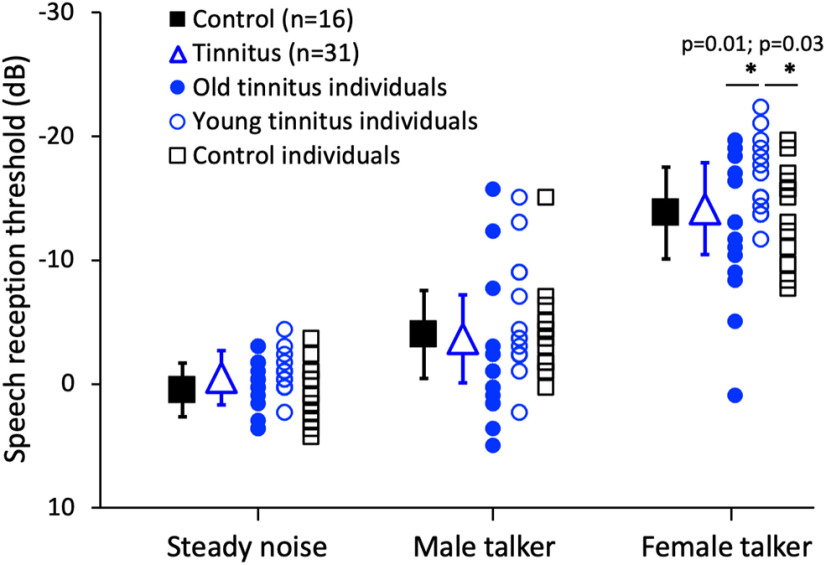
Figure 7.
SRTs for three backgrounds. The solid black squares represent the average SRTs for 16 control subjects, and the open blue triangles represent the average SRTs for 31 tinnitus subjects. Individual data are shown by blue solid circles for 18 old tinnitus subjects, blue open circles for 13 young tinnitus subjects, and black open squares for 16 control subjects. Error bars show ±1 SD of the mean. The asterisk and the line below represent significant differences between the groups for the female talk background.

