
Fig. 1.
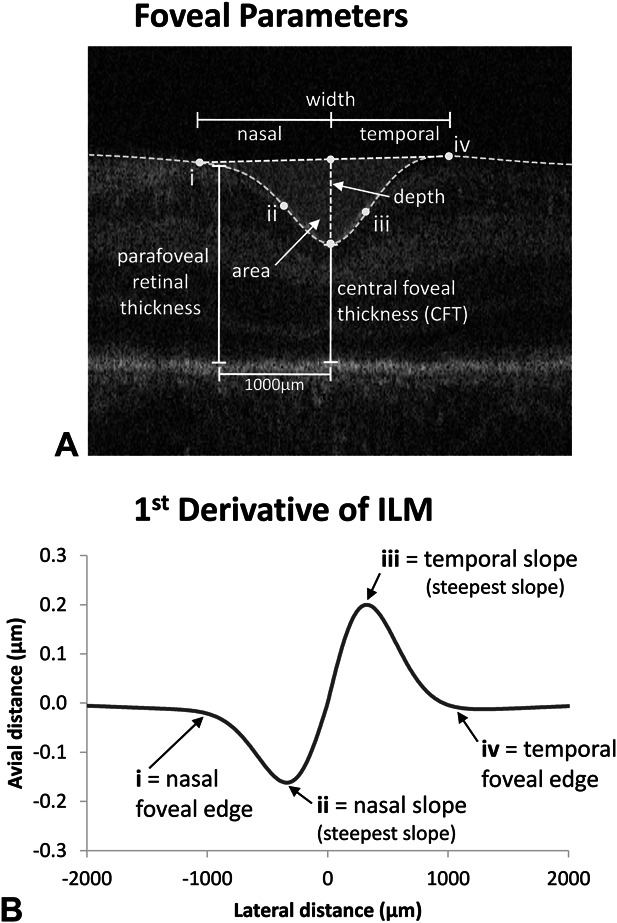
A. Foveal parameters are shown with respect to an original optical coherence tomography B-scan image. The nasal and temporal edges of the foveal depression are indicated by (i) and (iv), and the steepest foveal slope by (ii) and (iii), respectively. Parameters (i–iv) are defined using first, second, and third derivatives of the ILM. These are shown in (B) with respect to the first derivative of the ILM.