
Fig. 2.
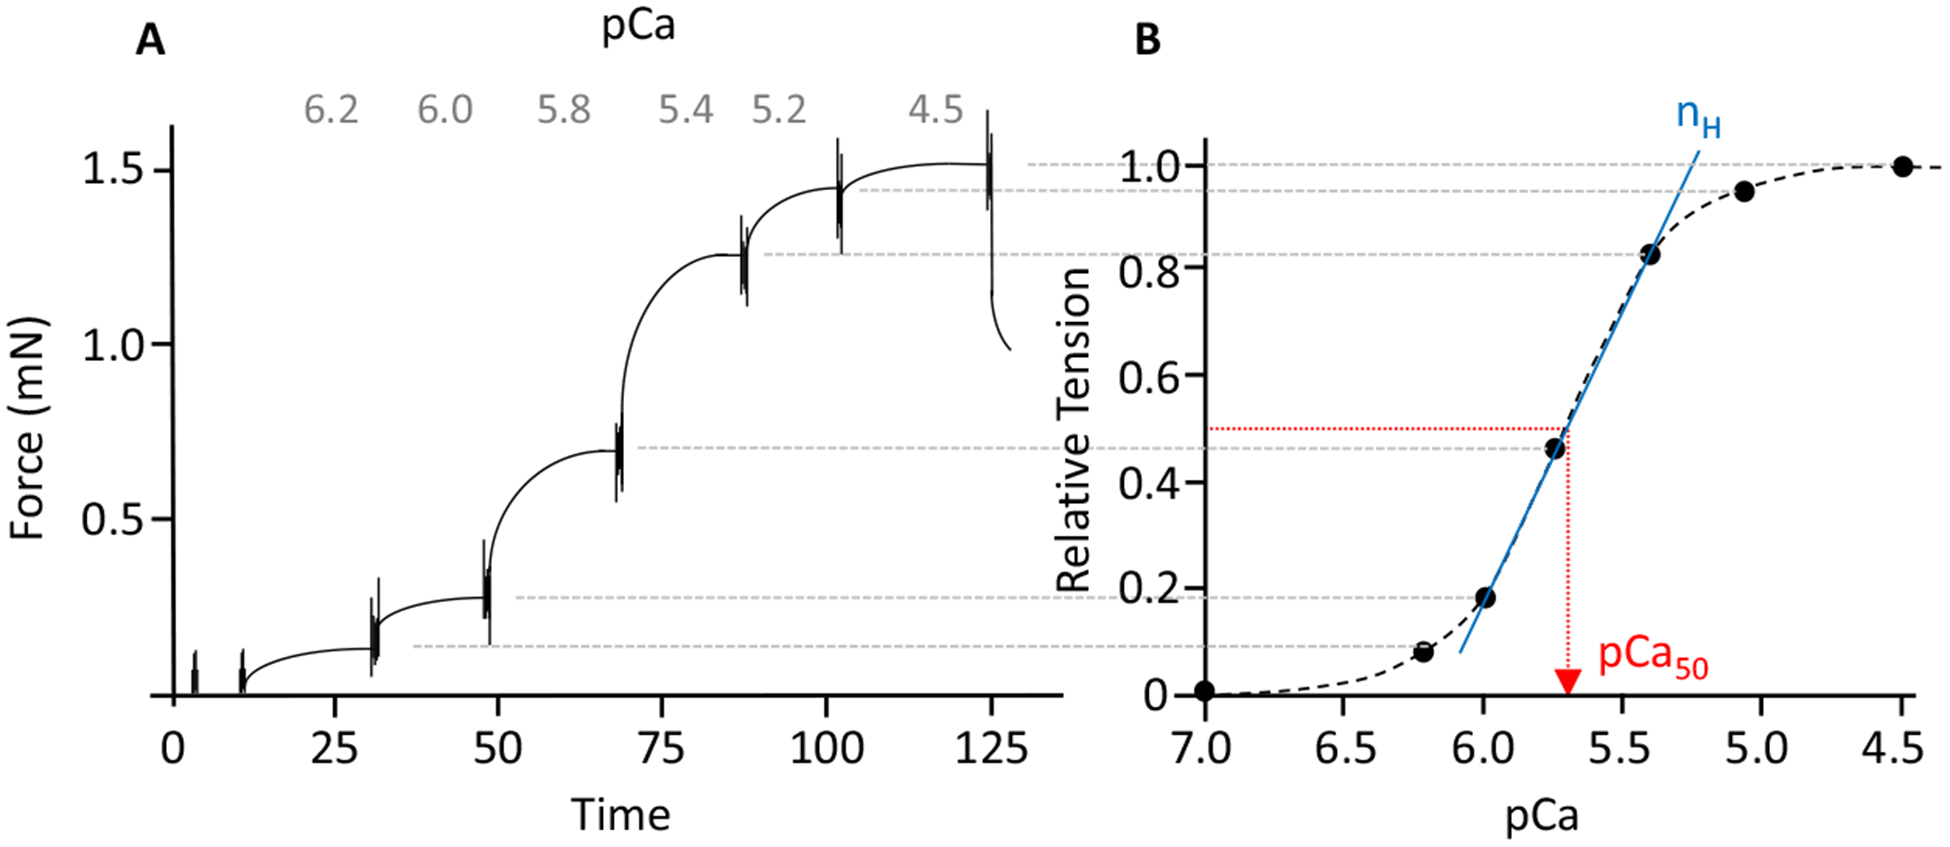
(A) Typical force trace representing the force response to incremental calcium concentrations, and (B) the corresponding force–pCa relation. The calcium concentration required for half-maximal activation (pCa50) was determined by fitting a modified Hill equation through the data point (the diagonal straight line shows the fit from which Hill coefficient (nH) is determined).