
Figure 1. High glucose conditions increase IAV-induced barrier independent of cell death.
(A) Schematic representation of the in vitro co-culture model of the alveolar epithelial-endothelial barrier. Image created with Biorender. Micrograph (40x magnification) of transwell membrane. (B) Left: Measurement of co-culture barrier integrity using TEER (Ω) readings following infection with medium (‘mock’) or IAV. Data are expressed relative to the baseline TEER and the TEER of mock-infected cells at each time point. Statistical significance was determined using a two-way ANOVA with a Bonferroni post-test. Right: Permeability of co-cultures to FITC-dextran 24 hr post-infection. Data shows the percentage of FITC detected in the lower compartment relative to mock-infected wells (defined as 0). Statistical significance was determined using a Student’s t-test. (C) Left: PFU/mL of IAV detected in the lower and upper compartment of the co-culture 24 hr post-IAV infection. A dashed line indicates the detection limit of the assay. Right: mRNA detected by qPCR in epithelial and endothelial cells 24 hr post-IAV infection. Viral replication represented as viral copy number. Statistical significance was determined using a Student’s t-test. (D) Percentage release of LDH from co-cultured epithelial (upper compartment) and endothelial (lower compartment) cells at 24 hr post-infection. Statistical significance was determined using a Student’s t-test. All data are pooled from a minimum of three independent experiments (with six biological replicates per group) and are shown as mean ± SEM. *: p<0.05.

Figure 1—figure supplement 1. TEER (Ω) of epithelial-endothelial co-cultures following 3–5 days of different glucose concentrations in the lower compartment of the transwell.
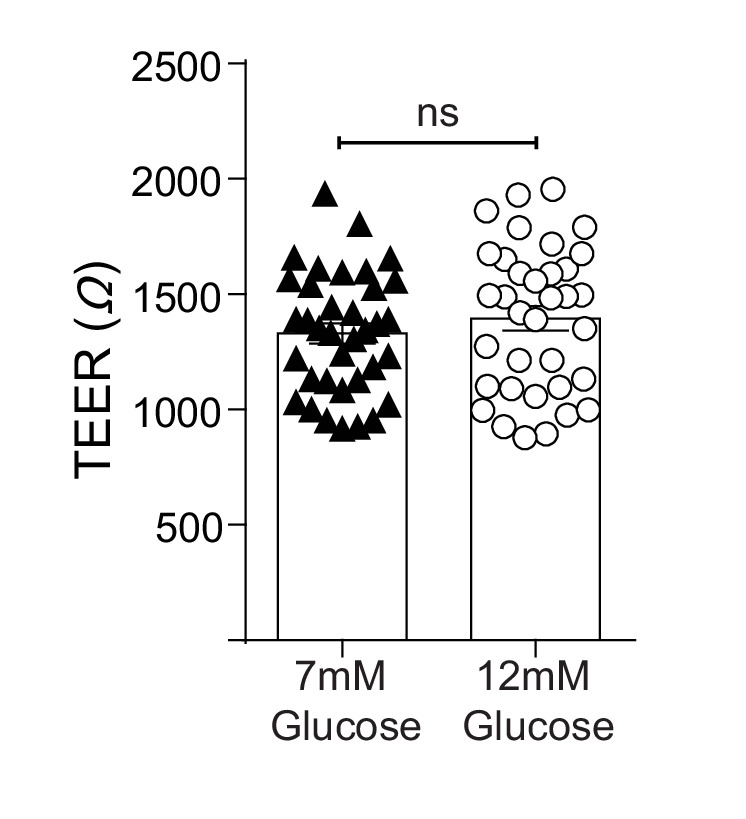
Figure 1—figure supplement 2. Tube formation of HPMECs under different media conditions.
