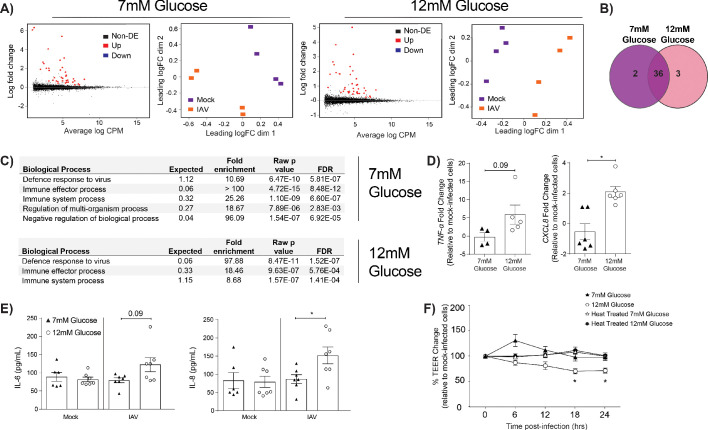
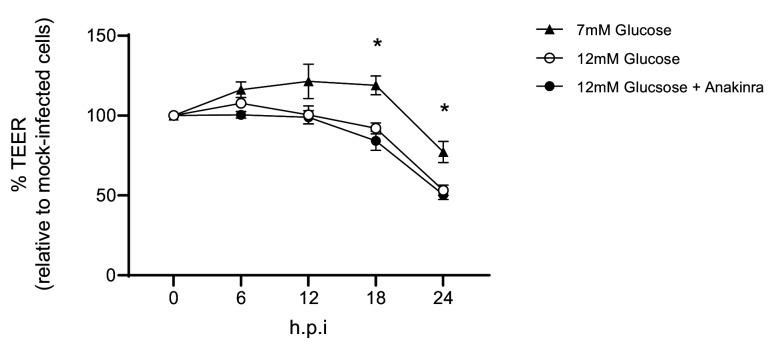
Figure 3. IAV-induced barrier damage in infected high glucose co-cultures is associated with a pro-inflammatory response in endothelial cells.
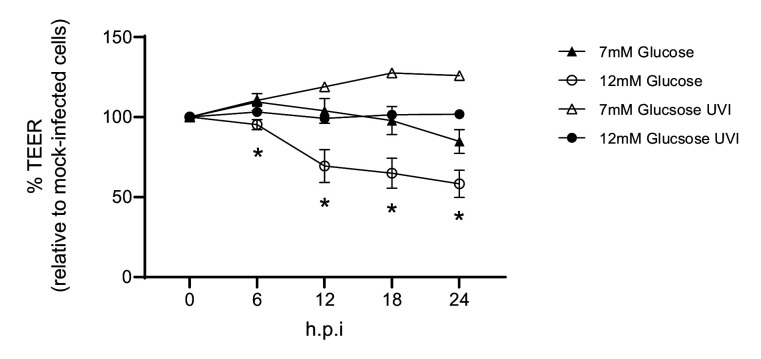
(A) Left: Mean difference (MD) plot depicts the relationship between gene-wise average log expression and the log-fold change comparison between IAV and mock infected cells. DE = differentially expressed. Right: Multi-dimensional scaling (MDS) plot of the endothelial cell sample used for RNASeq shows distinct clustering of samples by treatment group. (B) The number of DE expressed genes that are detected in endothelial cells derived from IAV-infected co-cultures (data collected at 24 hr post-infection). (C) Biological processes that are enriched in the endothelial cells derived from IAV-infected co-cultures at 24 hr post-infection. (D) Pro-inflammatory gene expression in co-culture endothelial cells. Data are normalised to GAPDH expression and fold change was calculated using the ΔΔCt method, expressed relative to mock infected cells. Data are mean ± SEM of an average of two technical replicates per group from a minimum of three independent experiments. (E) Levels of cytokines in the lower compartment (endothelial) cell culture supernatant 24 hr post IAV infection. Statistical significance was determined using a Mann-Whitney test. *: p<0.05. (F) Measurement of co-culture barrier integrity using TEER (Ω) readings after the addition of supernatant to the lower compartment. Supernatant was derived from the lower compartment of mock-infected or IAV-infected co-cultures with a history of 7 mM or 12 mM glucose. Harvested media was either heat treated or transferred without heat treatment. Data are shown relative to the TEER measured before the addition of the cell culture supernatant and to the TEER of wells subject to mock-infected supernatant transfer at each time point, for each glucose condition. Data are shown as mean ± SEM of three independent experiments (with six biological replicates per group). Statistical significance was determined using a two-way ANOVA with a Tukey post hoc test. *: p<0.05.


