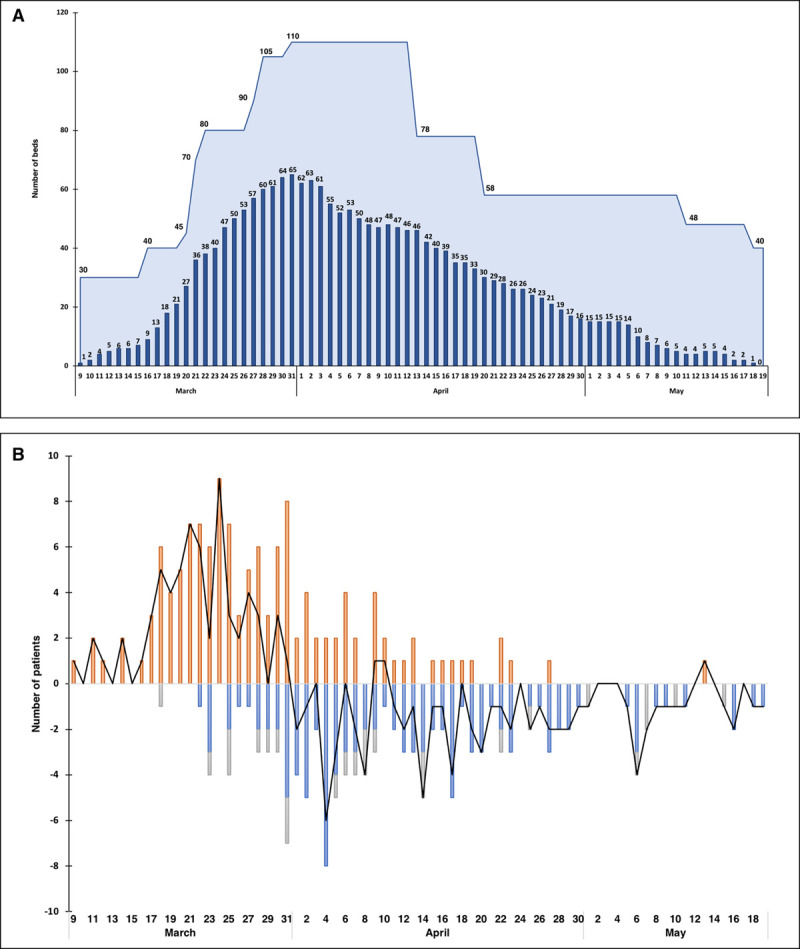
Figure 3.

Capacity and occupancy of ICU beds by coronavirus disease 2019 patients, and balance of patients with time. A, Capacity and occupancy of ICU beds by coronavirus disease 2019 patients. Navy blue bars represent the actual bed occupancy across time. The light blue area represents the total bed capacity. Total bed capacity constantly exceeded the number of occupied beds. B, Balance (black line) of patients across time between admissions (red bars), patients discharged from the ICU (blue bars), and deaths (gray bars).
