
Figure 1.
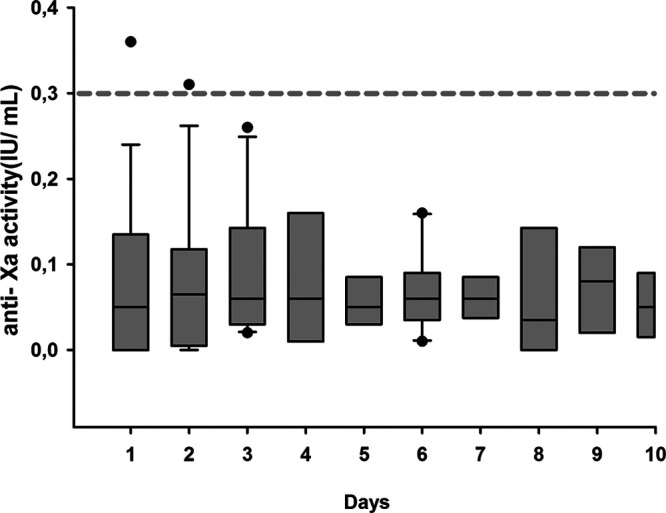
Trough anti-Xa activity in ICU patients with coronavirus disease 2019. Box plot for the through anti-Xa activity. The hatched line represents the limit of the trough anti-Xa activity. IU = international units.
Official websites use .gov
A
.gov website belongs to an official
government organization in the United States.
Secure .gov websites use HTTPS
A lock (
) or https:// means you've safely
connected to the .gov website. Share sensitive
information only on official, secure websites.
Trough anti-Xa activity in ICU patients with coronavirus disease 2019. Box plot for the through anti-Xa activity. The hatched line represents the limit of the trough anti-Xa activity. IU = international units.