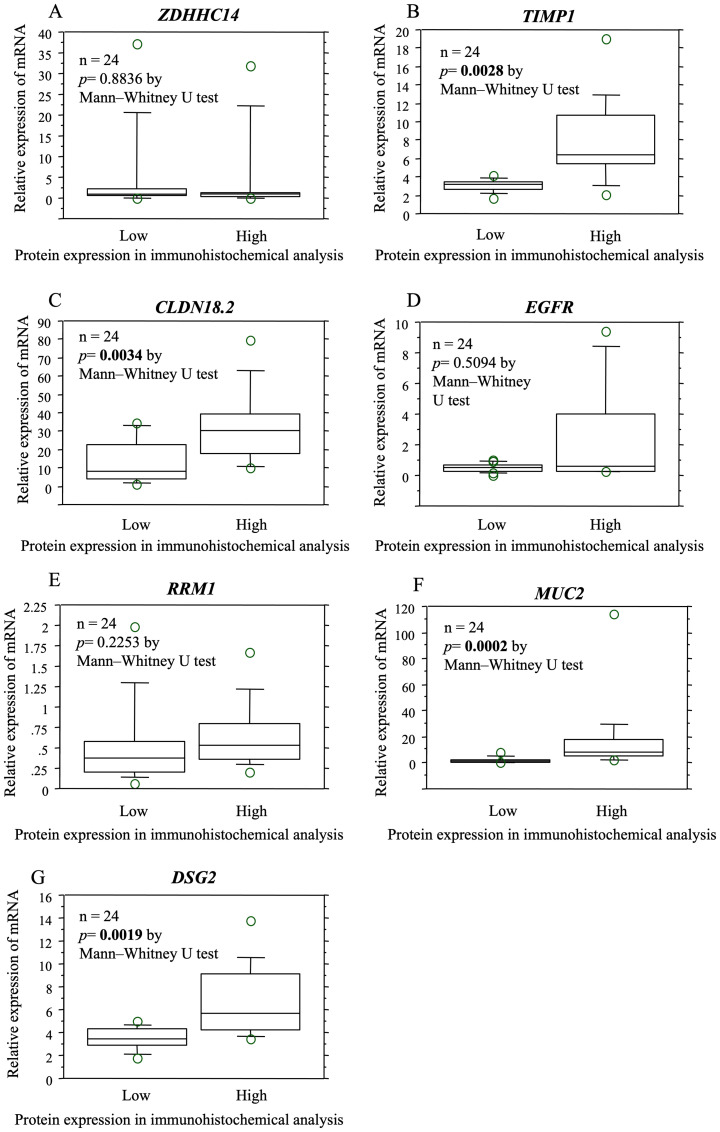
Figure 3. The relationship between protein and gene expression determined by immunohistochemical and mRNA expression analysis in the same specimens.
The expression of proteins encoded by the biomarker candidates was examined at the mRNA level in the same samples. Based on the comparison of the mRNA expression levels of samples that were high immunoreactivity and low/negative immunoreactivity, significant differences were observed in the mRNA expression levels of TIMP1 (B), CLDN18.2 (C), and DSG2 (G). There was no significant difference in the expression levels of ZDHHC14 (A), EGFR (D), RRM1 (E), MUC2 (F).

