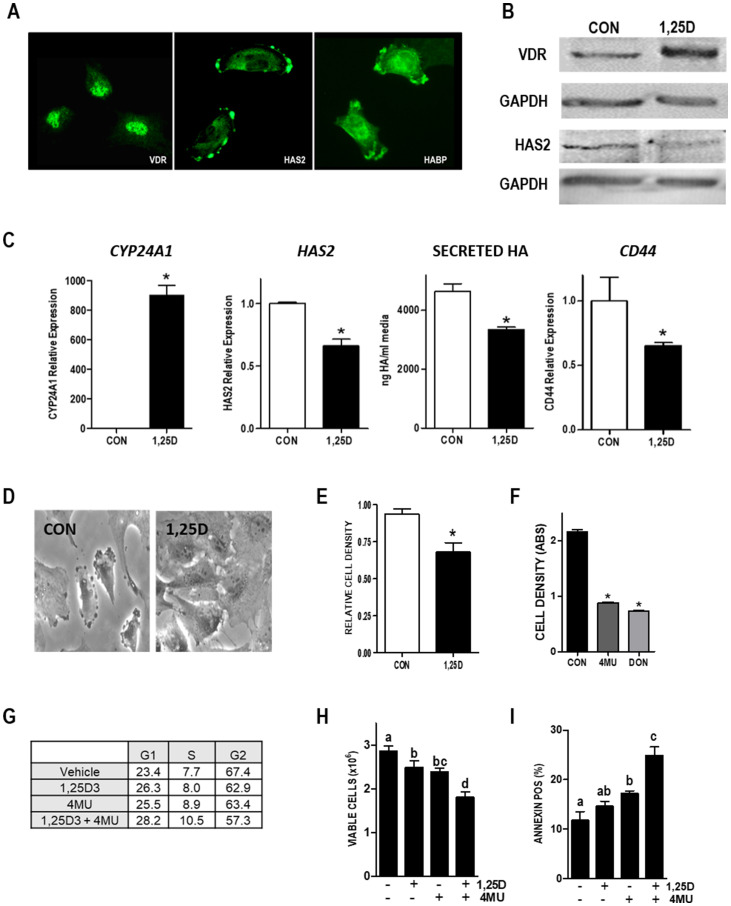
Figure 9. Vitamin D and HA pathways in Hs578T human TNBC cells.
(A) Images of VDR, HAS2, and HA localization in Hs578T cells. (B) Lysates from Hs578T cells treated with vehicle or 100 nM 1,25D3 for 48 hours were blotted with antibodies against VDR, HAS2, or loading control GAPDH. (C) RNA was isolated from Hs578T cells treated with 100 nM 1,25D3 for 24 hours. CYP24A1, HAS2 and CD44 were quantitated by RT-qPCR, normalized to 18S and expressed relative to vehicle treated cells. Secreted HA was evaluated by ELISA of conditioned media removed 48 hours after 1,25D3 or vehicle treatment. Bars represent mean ± standard error, with quadruplicates for RT-qPCR and triplicates for ELISA. * p < 0.05, control vs 1,25D3 treated in each cell line as evaluated by Student’s t test. (D) Phase contrast images of Hs578T cells treated with 100 nM 1,25D3 or vehicle for 96 hours. (E) Crystal violet assay for culture density was conducted in HS578T cells treated with 100 nM 1,25D3 for 144 hours. (F) Crystal violet assay for culture density was conducted in HS578T cells treated with HA synthesis inhibitors 4MU or DON for 96 hours. Data from growth assays are mean ± standard error of quadruplicates. * p < 0.05, control vs treated as evaluated by Student’s t test. (G) Percentages of cells in G1, S and G2 phases of the cycle after 96 hours treatment with 100 nM 1,25D ± 100 μM 4MU. Data are mean of duplicates with 5000 cells analyzed per run. (H) Viable cell count (mean ± standard deviation, n = 4) after 96 hours treatment with 100 nM 1,25D ± 100 μM 4MU. Bars annotated with different letters are significant at p < 0.05 by one-way ANOVA and Bonferroni post -test. (I) Percentage of Annexin positive cells indicative of apoptosis (mean ± standard deviation, n = 4) after 96 hours treatment with 100 nM 1,25D ± 100 μM 4MU. Bars annotated with different letters are significant at p < 0.05 by one-way ANOVA and Bonferroni post -test.

