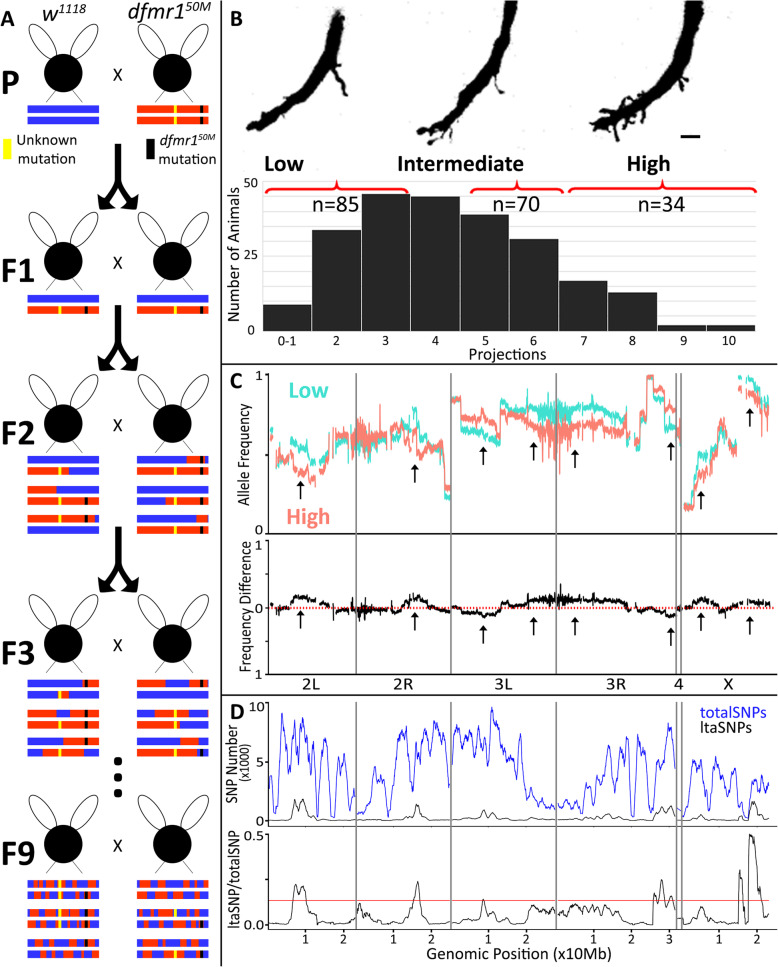
Fig. 8.
Bulked segregant analysis of synaptic projection quantitative trait loci. a BSA performed by crossing mutant (dfmr150M) with the paired control (w1118) to create a heterozygous F1 generation. Successive interbreeding of offspring for ≥ 9 generations generated recombinant inbred lines. Schematic recombinants are represented for w1118 background (blue), mutant background (red), dfmr150M deletion (black), and background mutation (yellow). b Top: The recombinant offspring segregated into three pools of low (0–3 projections), intermediate (5–6), and high (7+) GFI projection phenotype classes. Scale bar represents 5 μm. Bottom: The full distribution of GFI projection numbers from 234 GFI single-cell injections, pooled into phenotype classes. c Top: Low (light blue) and high (light red) phenotype classes plotted for w1118 SNP frequency, averaged in 100 kb windows across the four Drosophila chromosomes: 2 L/R, 3 L/R, 4, and X. Bottom: Difference in w1118 SNP frequency between the low and high phenotype classes. Arrows represent regions of divergence. d Top: The total combined SNPs (totalSNPs) for both bulks (blue) and the likely trait-associated SNPS (ltaSNPs, black) for both bulks plotted in 2 Mb sliding windows with 10 kb steps. Bottom: Ratio of ltaSNPs to totalSNPs, with a red line indicating the 99% confidence interval

