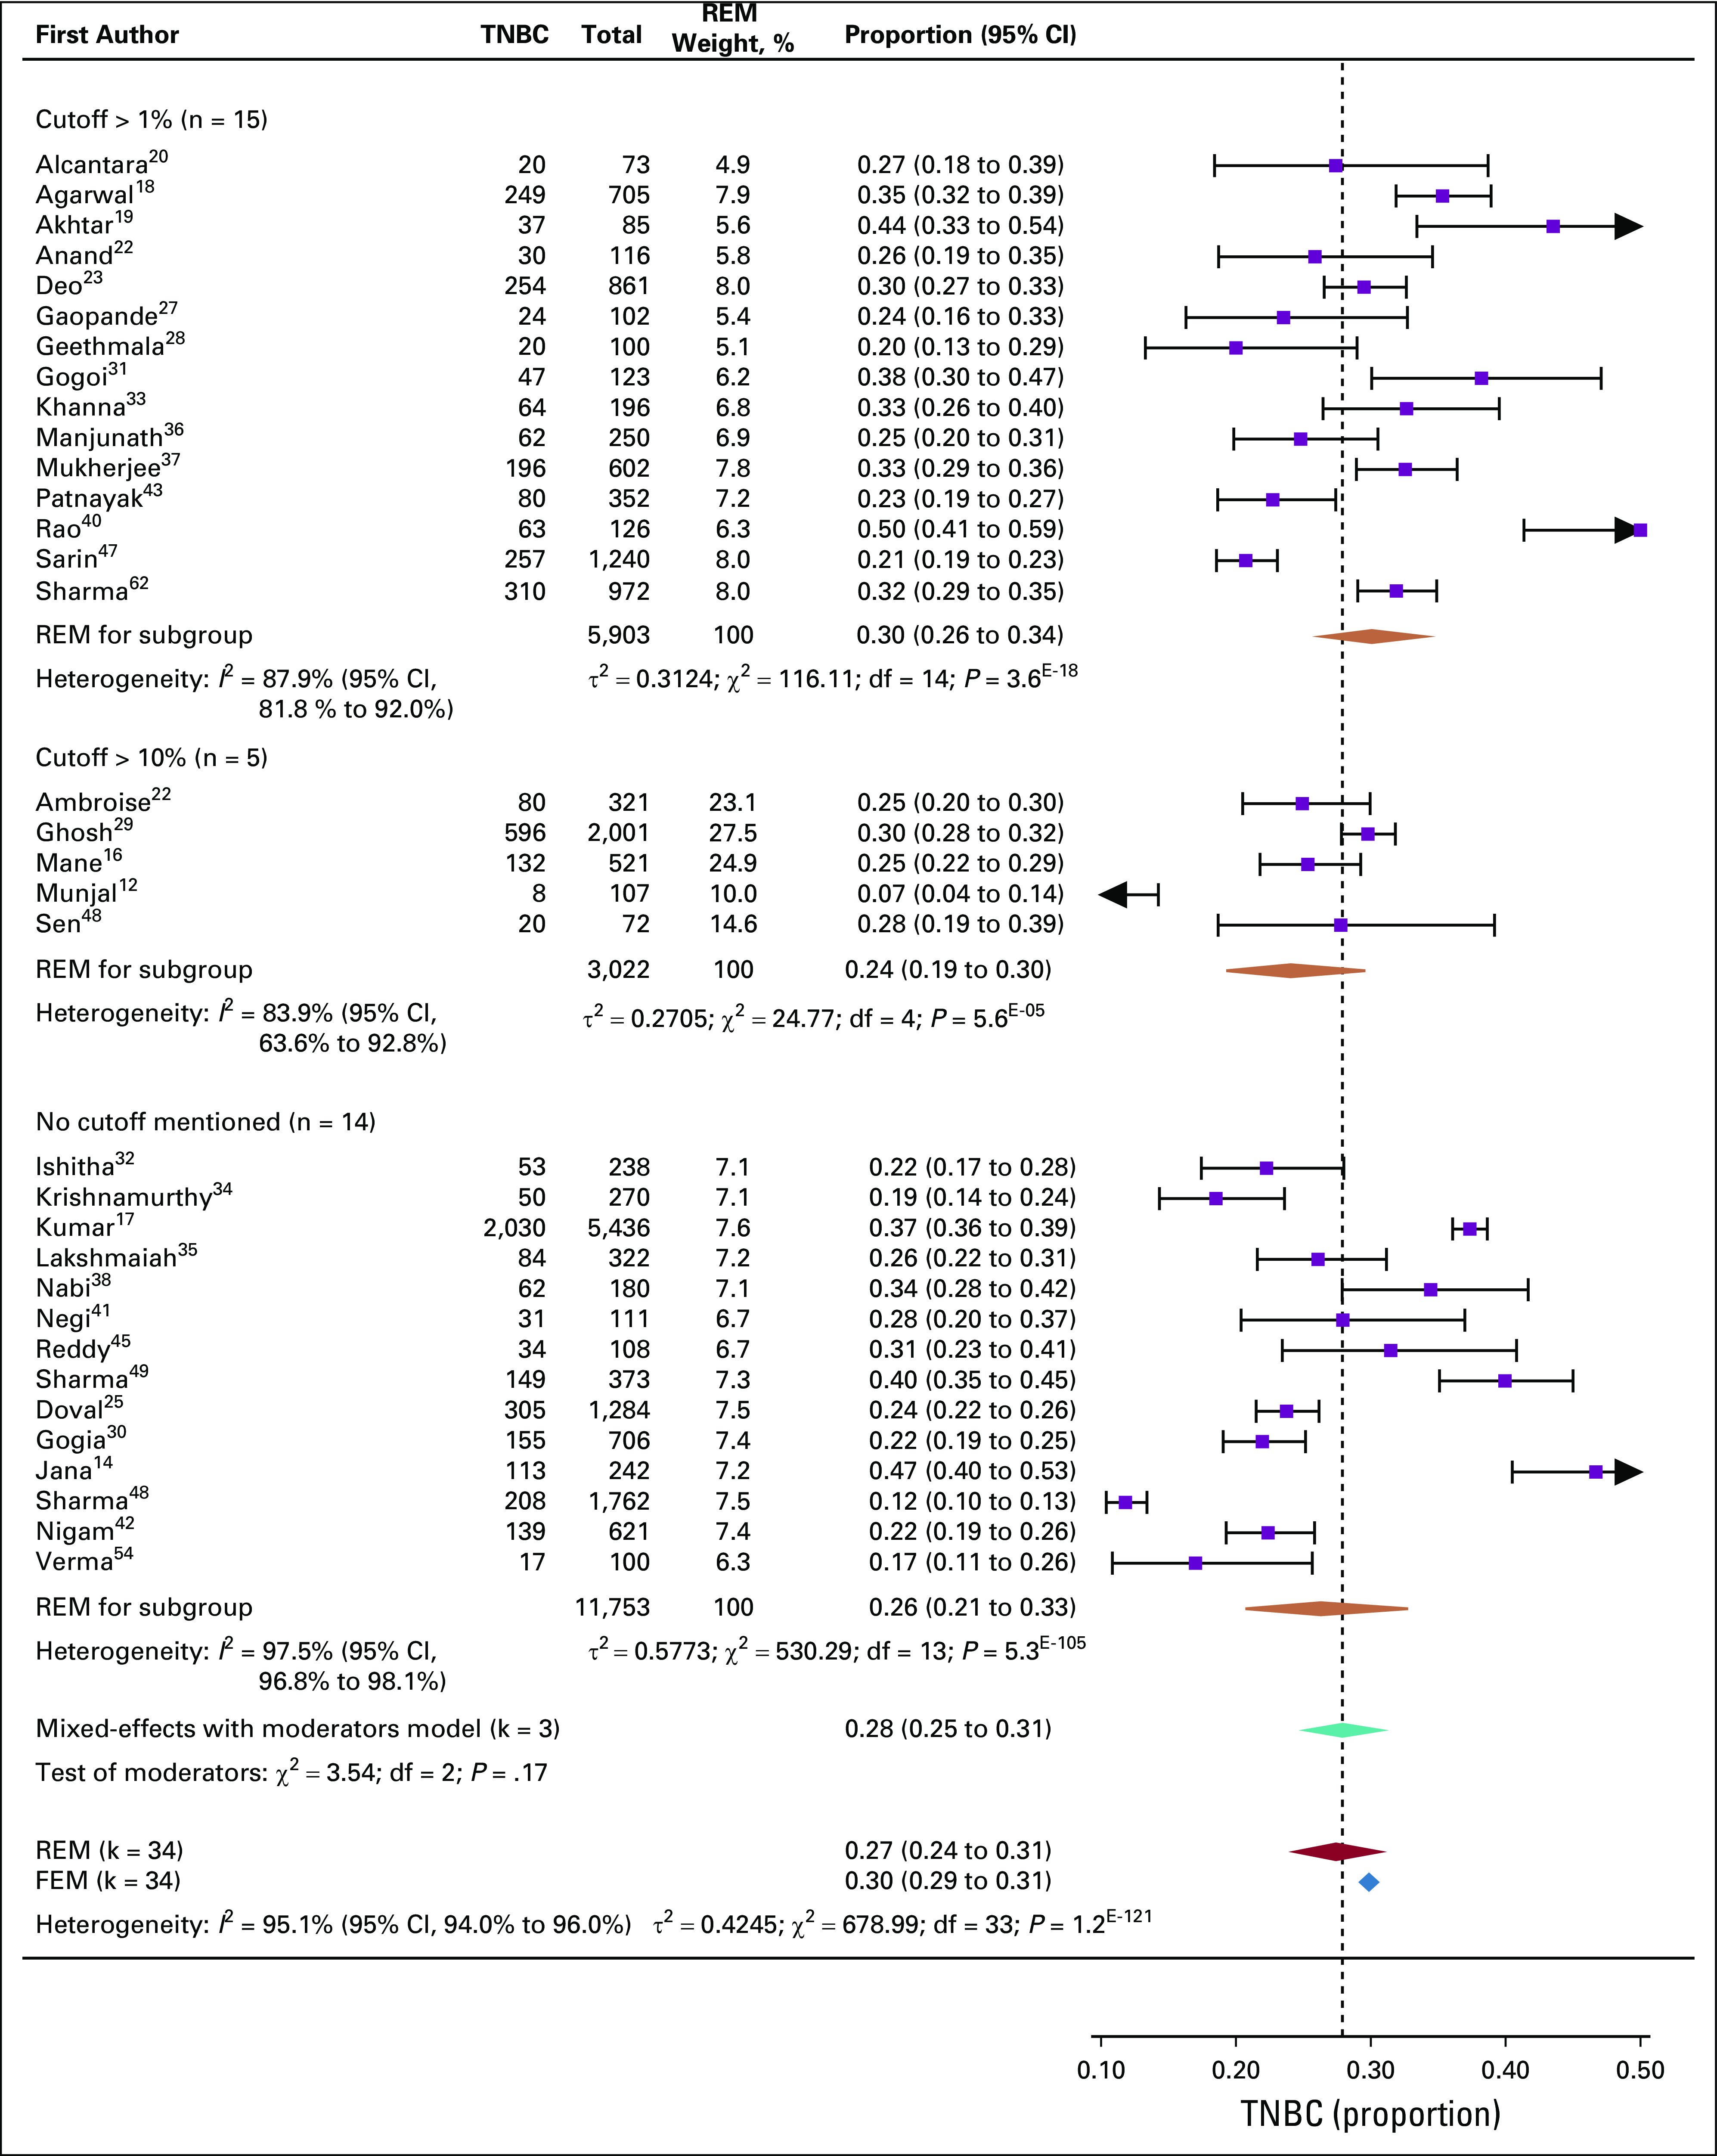
FIG 2.

Prevalence of triple-negative breast cancer (TNBC) in Indian cohorts. Forest plot of prevalence (%) of TNBC within 34 studies that reported data on Indian patients with breast cancer. Subgroups were made by guidelines followed for estrogen receptor (ER)/progesterone receptor (PR) positivity: studies that used 1% expression of ER/PR as a cutoff, 10% expression of ER/PR as a cutoff, or studies that did not mention the ER/PR expression criteria. Heterogeneity (I2) is noted to be significantly high for each subgroup as well as for all 34 studies together. Combined pooled prevalence for all 34 studies estimated by a random-effects model (REM) is shown in purple. The fixed-effects estimate is also shown. Pooled prevalence for each subgroup computed with random effects is shown as orange diamonds. The subgroup variances are pooled together in a mixed-effects model (FEM; teal diamond). Intergroup variance in pooled prevalence is tested by Wald test, and test of moderators are not significant. The spread of each diamond represents the 95% CIs for the pooled estimate. The dotted line represents the proportion calculated from the mixed-effects model with moderators.
