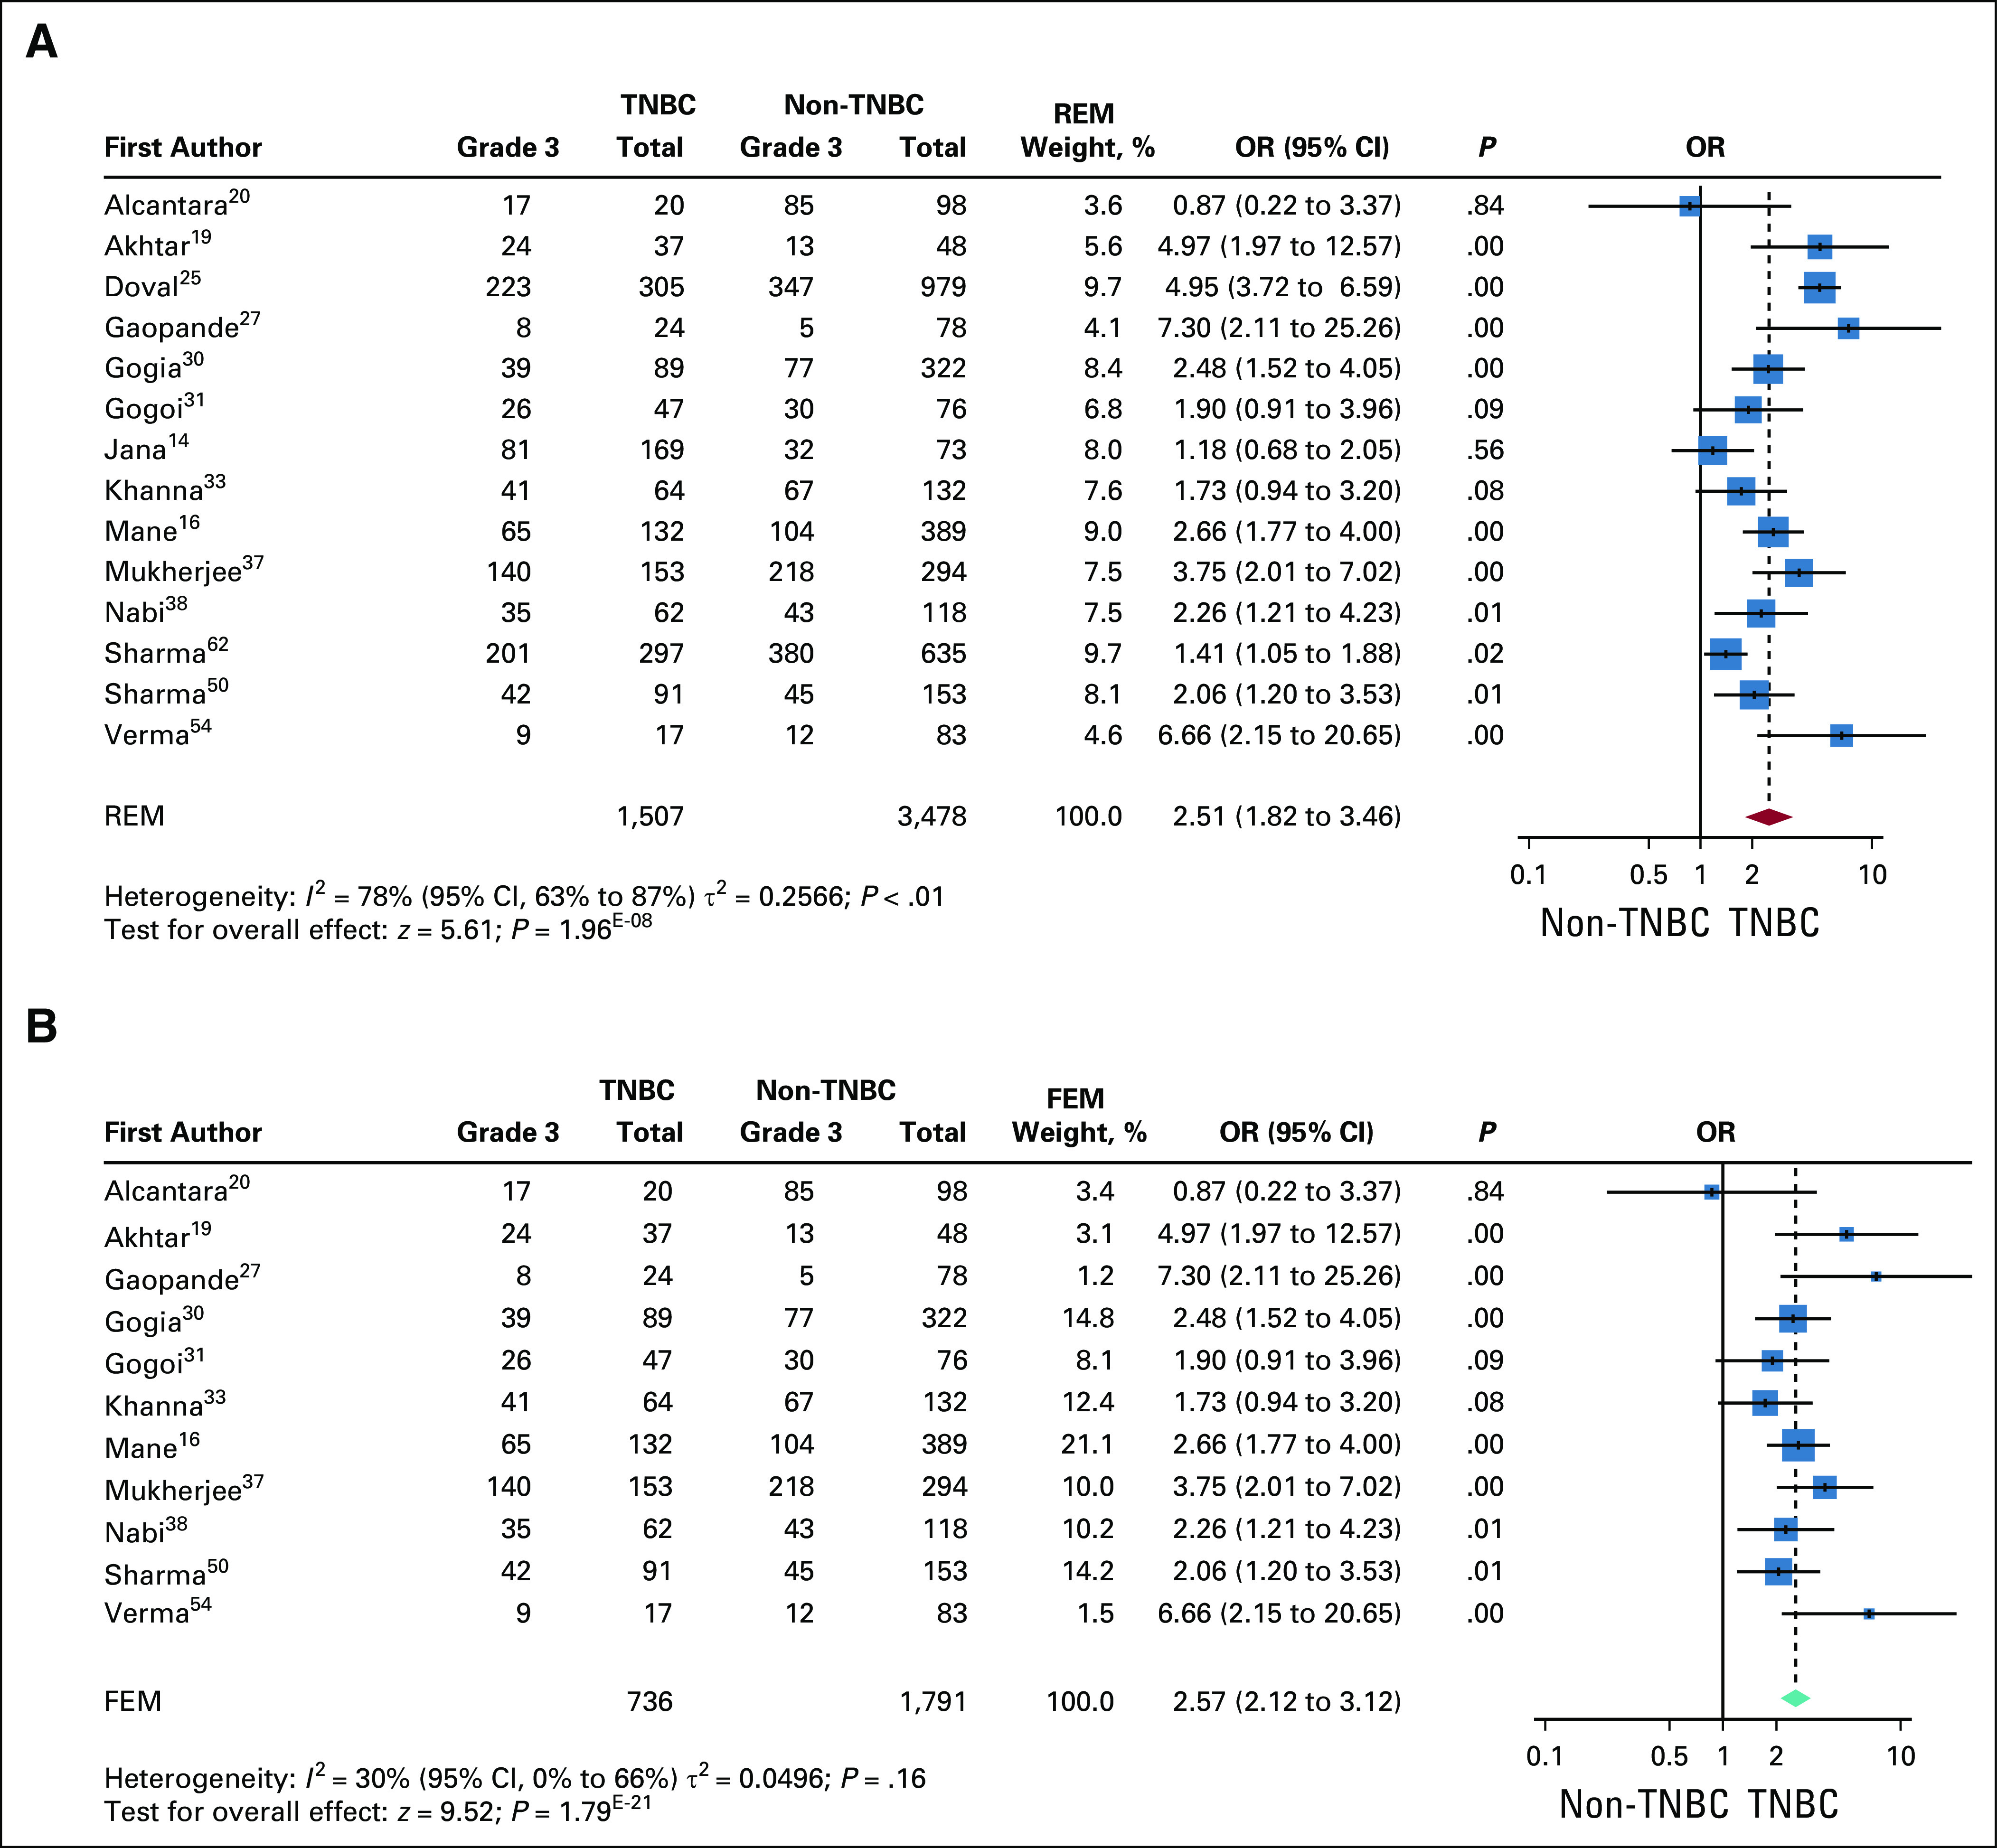
FIG 4.

Comparison of high grade at incidence between triple-negative breast cancer (TNBC) and non-TNBC. (A) Forest plot of odds ratio (OR) for high grade in TNBC v non-TNBC for 14 studies. Studies were significantly heterogenous and showed higher ORs for high grade at incidence in TNBC. The P value for comparison within each study is also shown. The red diamond and the dotted line represent the random effects pooled estimate of the OR, while the teal diamond represents the fixed-effects model (FEM). (B) Forest plot of ORs for high grade after removal of outliers. The analysis shows 3 studies (Doval et al,25 Sharma et al,49 and Jana et al14) to be outliers in the pooled OR (Data Supplement). These studies were excluded and the pooled OR recomputed. Because the heterogeneity among the remaining the 10 studies is reduced (I2 = 30%), the fixed-effects estimate of the pooled OR is shown (green diamond). The pooled OR shows a significantly increased OR for high grade in TNBC v non-TNBC. FEM, fixed-effects model; REM, random-effects model.
