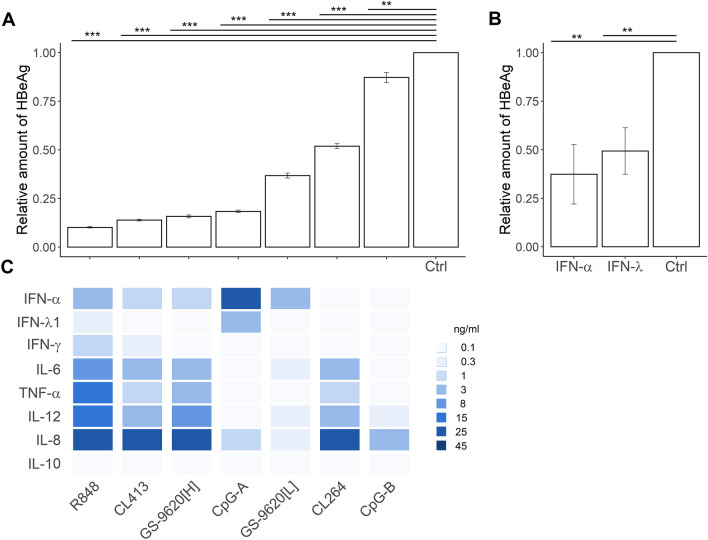
Figure 2.
Inhibition of HBeAg production from HBV-infected PHH treated with PBMC CM. (A) A total of 65,000 PHH were infected with 500 viral genome equivalents (VGE) of HBV per cell and cultured for 3 days before conditioned medium (CM, diluted 1:10) was added. CM was derived from 3 × 10⁶ PBMCs per ml stimulated by agonists of TLR2/7 (CL413), TLR7 (CL264, GS-9620[L]), TLR7/8, (R848, GS-9620[H]), or TLR9 (CpG-A, CpG-B) for 16 h. CM was added again 6 days post-infection (DPI). Production of HBeAg was determined by ELISA 9 DPI and normalized to production by HBV-infected PHH in the absence of CM. The HBeAg data are shown as mean ± SEM from five independent experiments with PHH from three donors (N = 3). **p < 0.01, ***p < 0.001 pairwise Wilcoxon test. Kruskal–Wallis p < 2.2 × e−16. (B) HBV-infected PHH treated with 1,000 IU/ml of recombinant IFN-α-2a or IFN-λ3. The data are shown as mean ± SEM from three independent experiments with PHH from two donors (N = 2). **p < 0.01, Mann–Whitney–Wilcoxon pairwise test, p value adjusted by Benjamini–Hochberg (BH) method. (C) Quantity of cytokines in CM from stimulated PBMCs plotted as a heat diagram representing the median values that is shown in Fig. 1.

