Figure 6.
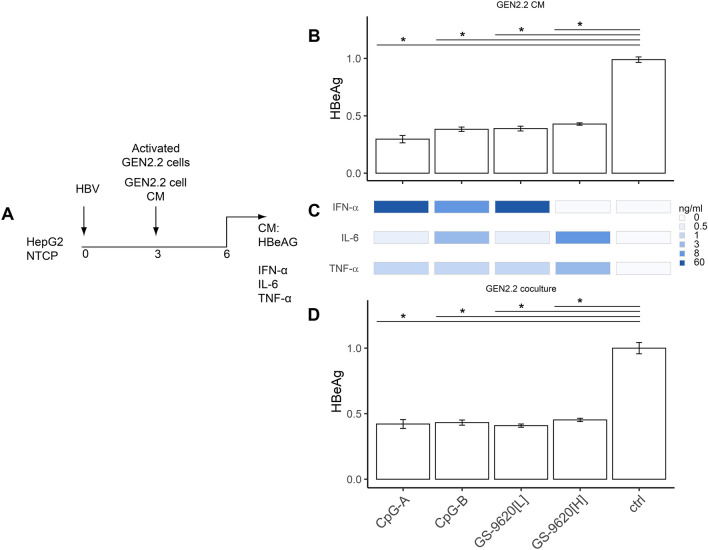
Antiviral activity of stimulated GEN2.2 pDCs on HBV-infected HepG2-NTCP cells. (A) Experimental flow chart. A total of 60,000 HepG2-NTCP cells were infected with 2000 VGE per cell of HBV and cultured for 3 days before CM from GEN2.2 cells stimulated with CpG-A (4 µg/ml), CpG-B (4 µg/ml), or GS-9620[L or H] (50 nM or 10 µM) was added (B). Levels of IFN-α, IL-6 and TNF-α (D) in CM were determined by ELISA 6 DPI. HBV-infected HepG2-NTCP cells were cocultured with 100,000 stimulated GEN2.2 cells (C). Production of HBeAg was normalized to production by HBV-infected HepG2-NTCP cells in the absence of pDCs. The data are shown as means ± SEM from three independent experiments. *p < 0.05, Mann–Whitney–Wilcoxon pairwise test, p value adjusted by BH method.

