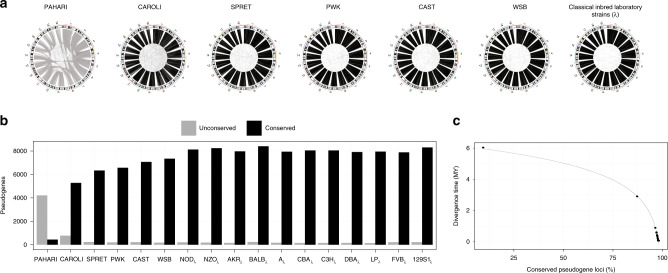
Fig. 5. Pseudogene loci conservation across mouse strains.
a CIRCOS-like plots showing the conservation of the pseudogene genomic loci between each mouse strain and the laboratory reference strain C57BL/6NJ. Grey lines indicate a change of the genomic locus between the two strains and connect two different genomic locations (e.g., a pseudogene located on chr7 in C57BL/6NJ and chr1 in M. pahari). Black lines indicate the conservation of the pseudogene locus. b The number of pseudogenes that are preserved or changed their loci between each strain/species and the laboratory reference strain. Associated data is available in Supplementary Table 6. c Strain speciation times as a function of percentage of conserved pseudogene loci between each strain/species and the laboratory reference, fitted by an inverse logarithmic curve.

