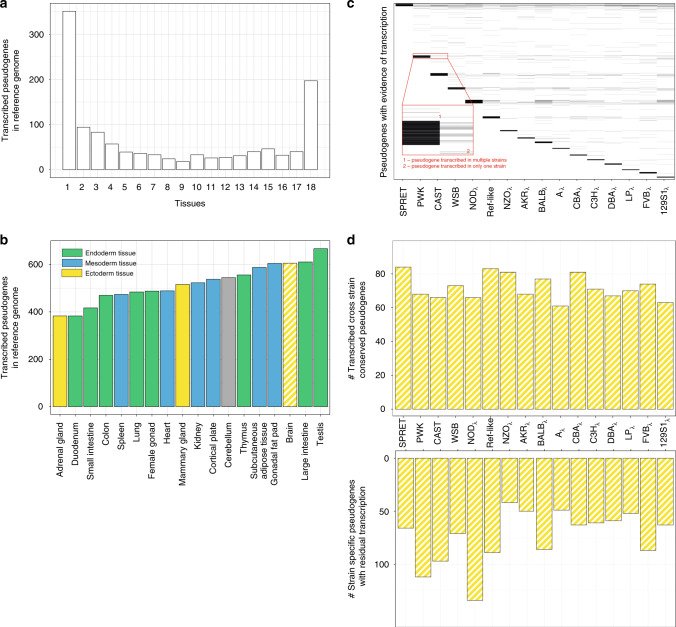
Fig. 7. Pseudogene transcription and activity.
a Cross-tissue pseudogene transcription in the mouse reference genome. The x-axis indicates the number of tissues in which a pseudogene is transcribed. b Distribution of pseudogene transcription in 18 adult mouse tissues. All data of the transcribed mouse reference genome pseudogenes in the 18 tissues is available in Supplementary Data 6. c Heatmap-like plot showing the distribution of transcribed pseudogenes (y-axis) in brain tissue for each wild-derived and classical laboratory mouse strain (x-axis). Each line corresponds to a transcribed pseudogene with an expression level higher than 2 (FPKM). When a line is present across multiple columns, it is indicative of a pseudogene expressed in all these strains. The dark bars at the top of each strain column are formed by multiple highly expressed pseudogenes. When a line is present in only one strain, and no other line is observed at the same level in any of the other strains, this suggests that the pseudogene expression is strain specific. d (top) Number of transcribed pseudogenes that are conserved across all the strains. d (bottom) Number of transcribed strain-specific pseudogenes in each mouse strain. Data recording the transcribed pseudogenes in brain for each strain is available from Supplementary Data 7.

