Figure 2.
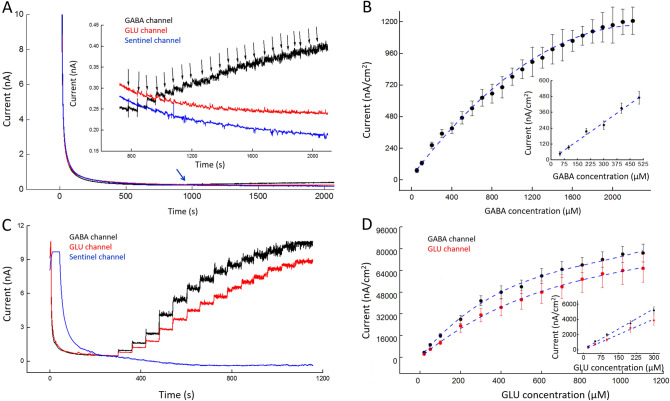
Characterization of GABA and GLU microwire biosensors. Measurements were acquired in 1X PBS containing 1 mM α-keto with a 200-rpm stirring rate at 37 °C. Amperometry parameters were + 0.7 V vs Ag/AgCl. (A) Representative plot of the response to GABA at the GABA (black), GLU (red), and sentinel (blue) microwire biosensors. Inset A Detail of (A) from 600 to 2,100 s. Black arrows correspond to the stepwise addition of GABA (50, 100, 200, 300, 400, 500, 600, 700, 800, 900, 1,000, 1,100, 1,200, 1,300, 1,400, 1,500, 1,600, 1,700, 1,800, 1900, 2000, 2,100, and 2,200 μM GABA respectively). As expected, corresponding stepwise increases in current occurred with increasing GABA concentration. The first two downward black arrows indicate addition of 50 μM GABA; this was followed by 20 subsequent additions of 100 μM GABA. GLU and sentinel channels were unaffected. (B) Current density at GABA biosensor increases with increasing concentration of GABA (mean ± SEM, n = 3). Inset B The linear response range is 0–500 μM GABA (slope of linear fit is 0.96 ± 0.15 nA/µM cm2, R2 = 0.982). Sensitivity in linear range is 1.2 ± 0.4 nA μM−1 cm−2. (C) Representative plot of the response to GLU at the GABA (black), GLU (red), and sentinel (blue) microwire biosensor. Both microwire biosensors show stepwise increases in current as GLU concentration increases (black downward arrows denote addition of GLU, 20, 50, 100, 200, 300, 400, 500, 600, 700, 800, 900, 1,000, 1,100, and 1,200 μM GLU respectively). (D) Current density at GABA and GLU biosensors increases with increasing concentrations of GLU (mean ± SEM, n = 3). Inset D The range of the linear response is 0–300 μM GLU. Sensitivity of GLU in the linear range is 144 ± 20 nA μM−1 cm−2 for the GABA microwire and 128 ± 25 nA μM−1 cm−2 for GLU microwire (mean ± SEM, n = 3 each, difference is not significant, p = 0.43).

