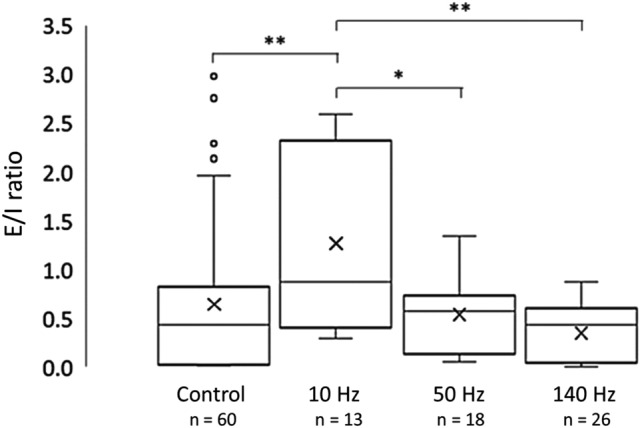
Figure 7.

Excitatory vs inhibitory ratios. Ratio of peak concentrations of GLU (excitatory input, E) and GABA (inhibitory input, I). The E/I ratio decreased with increasing stimulation frequency. Significant decreases occurred between 10 and 50 Hz, and 10 and 140 Hz stimulation. A non-significant trend toward lower E/I values was observed for higher frequency stimulation between 50 and 140 Hz (p = 0.09). Wilcoxon rank sum test, *p < 0.05; **p < 0.01.
