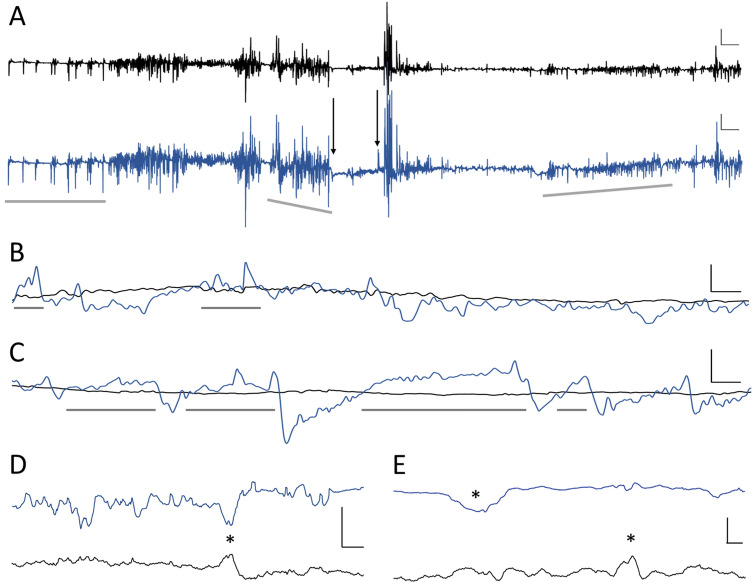
Figure 8.
In vivo GLU (black) and GABA (blue) dynamics change with different types of behavior. Current shown in all panels is after subtraction of sentinel current for both channels and subtraction of GLU current from the GABA channel. (A) Several behaviors are captured in this 8-min 40-s recording. Interictal-like peaks appear in the first 70 s when the rat is not moving (horizontal gray bar). This is followed by walking and grooming (after the left gray bar and through the middle gray bar). Movement ceased between the two downward arrows as the rat abruptly stopped moving (frozen posture). A rapid decrease in GLU and GABA occurred at the onset of freezing (left arrow). GABA gradually increased until the point when the rat clearly exhibited seizure behavior with forelimb clonus, which is a Racine Scale 3 behavior during epileptic seizures in rats. Coinciding with clonus are brief sharp peaks in both neurotransmitters (right arrow). After this, GABA and GLU fluctuated rapidly, and after a few seconds the rat reared and fell, which are Racine Scale 4 and 5 behaviors, respectively. Maximum current fluctuations in both biosensor channels were observed just before and through rearing. After the rat ceased rearing, it continued to exhibit mouth and facial movements with some occasional head bobbing for the remainder of this recording segment. These are Racine Scale 1 and 2 behaviors, respectively61. During this period, GABA current dropped rapidly (just before inclined gray bar, A) and then steadily rose (slope denoted by inclined gray bar on right, A). Vertical scale bar denotes 1 nA and horizontal scale bar represents 20 s for both GLU and GABA traces. (B, C) Representative sleep–wake cycles at Wk 16 that illustrate the changes in GABA. GABA current steadily increased prior to each of six episodes of sleep (gray bars), during the rat’s light cycle, and remained elevated with some fluctuation during sleep. Immediately prior to waking, GABA levels rapidly fell and remained low during activity. Vertical scale bars denote 0.5 nA and 1.0 nA for top and bottom plots, respectively, and horizontal scale bars represent 2 min for both. (D) Representative recording two weeks after cannula implantation while the rat was walking in its home cage. Asterisk marks a concurrent decrease in GABA with an increase in GLU current. Vertical scale bar denotes 0.1 nA, and horizontal scale bar represents 125 ms. (E). Recording segment from the same rat, as shown in (D), eight weeks after the first recording. The rat was also walking in its home cage during this time period. Asterisks denote a decrease in GABA and an increase in GLU current; these events are separated by 600 ms. Vertical scale bar denotes 0.2 nA and horizontal scale bar represents 100 ms.

