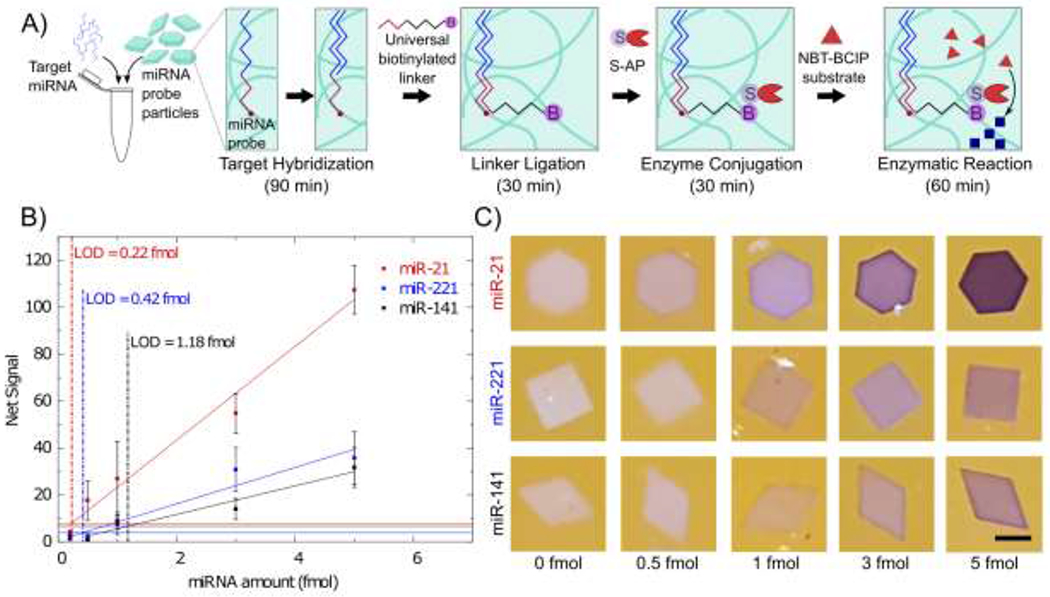
Figure 3.

A) Schematic of miRNA hybridization assay. Particles are co-polymerized with an acrylated probe specific to a miRNA target. Each shape is specific to a different target. The target binds to the probe and then a universal biotinylated linker is ligated to the target. S-AP binds with the biotin and catalyzes the reaction converting NBT and BCIP to an insoluble NBT diformazan. B) Calibration curves of 3 different miRNA. Reaction time was 1 hour. Vertical dashed lines show the limit of detection. Horizontal lines show the 3σ level. Error bars represent 1 standard deviation. Pearson correlation coefficients for the linear fits are 0.99, 0.968, and 0.969 for miR-21, miR-221, and miR-141 respectively. C) Representative images of particles after 1 hour of reaction for each miRNA. Scale bar is 200 µm.
