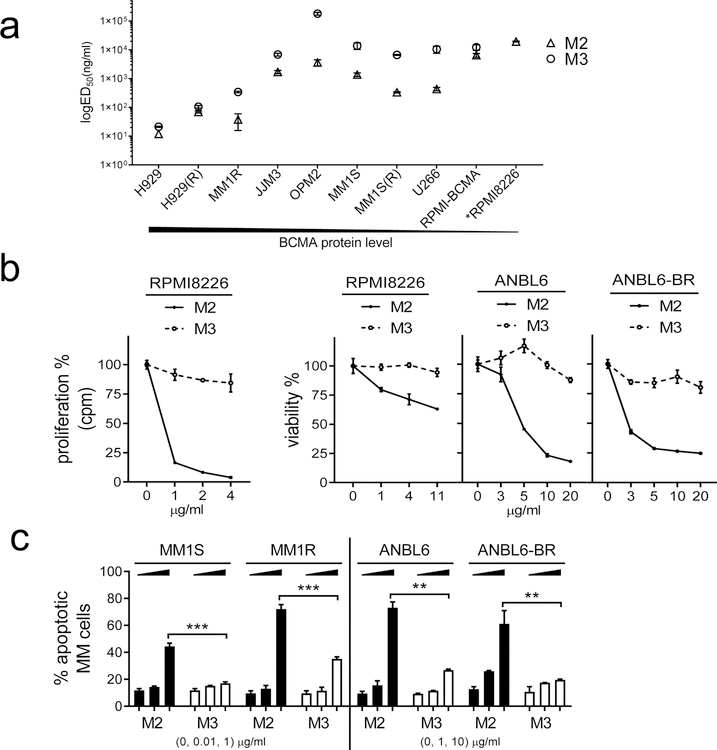
Fig. 1. MEDI2228 (M2) induces more potent cytotoxicity against MM cells than its MMAF-ADC homolog (M3).
a Serial dilution of M2 or M3 were added into MM cell cultures for 3d followed by CCK8 cell viability assay. BCMA protein levels determined by flow cytometry (FCM) analysis (at the bottom) are highest and lowest in H929 and RPMI8226, respectively. Shown are ED50 values for M2 (open triangle) and M3 (open circle). Data represent the mean (± standard deviation, SD) of three independent experiments, each performed in triplicate at each dose. Error bars indicate SDs. H929(R) and MM1S(R) cells derived from H929 and MM1S, respectively, are resistant to both len and pom. RPMI-BCMA, RPMI8226 cells overexpressing BCMA; *RPMI8226, relatively insensitive to M3 due to unavailable ED50 (see also in b). b M2 (asterisk, solid line) or M3 (open circle, dash line) were added for 3d, followed by cell proliferation assay using [H3] thymidine incorporation (left) in RPMI8226 cells. Viability assays (right) are based on CCK8 for RPMI8226 and luminescent-based Cell-Titer Growth (CTG) for paired ANBL6 and ANBL6-BR (bortezomib (btz)-resistant) MM cells. c Dexamethasone (dex) (MM1S/MM1R)- and btz (ANBL6/ANBL6-BR)-resistant cell pairs were treated with M2 or M3 for 2d, followed by FCM analysis to determine percentages of apoptotic cells (Annexin V+/Aqua− and Annexin V+/Aqua+). ***, p<0.0005; **, p<0.005. Each experiment was performed at least thrice in triplicate for each dose, and data are represented as mean ± SD.

