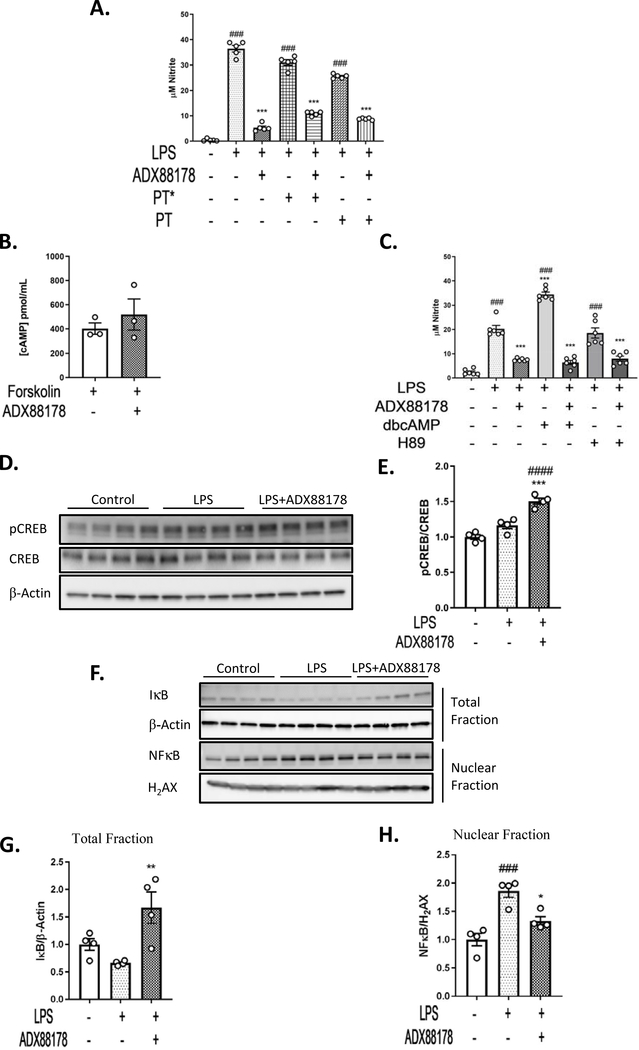
Fig. 5. ADX88178 Promotes CREB Phosphorylation and NFkB Inhibition in LPS-Activated BV2 Microglia.
The mechanism of action of ADX88178 was evaluated by assessing components of classical Gαi/o pathway as well as the non-classical NFkB pathway. (A) Treatment with pertussis toxin (PT) did not inhibit anti-inflammatory action of ADX88178. LPS caused a significant increase in NO levels in LPS alone, LPS+PT* and LPS+PT groups (###P<0.001 for all three). ADX88178 attenuated NO in LPS alone, LPS+PT* and LPS+PT (***P<0.001 for all three). (B) ADX88178 did not attenuate forskolin-induced cAMP level in BV2 microglia as measured by cAMP ELISA. (C) LPS alone and LPS+H89 increased released nitrite levels in BV2 microglia compared to control (###P<0.001 for all three treatments) while LPS+dbcAMP significantly increased NO levels compared to LPS (***P<0.001, LPS vs. LPS+dbcAMP). ADX88178 significantly decreased LPS-induced NO levels in all three treatments (***P<0.001). (D) BV2 cells were pretreated with ADX88178 for 30 minutes followed by stimulation of LPS (20ng/mL) for 30 minutes. Whole cell lysates were used for Western blot analysis. Representative blots for pCREB and CREB. (E) Densitometric analysis shows a significant increase in pCREB/CREB protein level in LPS+ADX88178 treated BV2 microglia compared to LPS alone (***P<0.001, LPS vs. LPS+ADX88178). (F) Representative blots for nuclear and total BV2 microglia fractions. (G) ADX88178 treatment significantly increased IkB protein expression in the total fraction (**P<0.01, LPS total vs. LPS+ADX88178). (H) LPS stimulation of BV2 microglia significantly increased NFkB protein expression in the nuclear fraction (###P<0.001, control vs. LPS) while ADX88178 significantly decreased NFkB nuclear translocation (P<0.05, LPS vs. LPS+ADX88178). All data were analyzed using one-way ANOVA for multiple comparisons with post hoc Tukey’s test. ###P<0.001, ####P<0.0001 in comparison with control; *P<0.05, **P<0.01, ***P<0.001 in comparison with LPS for each treatment.

