
Figure 10:
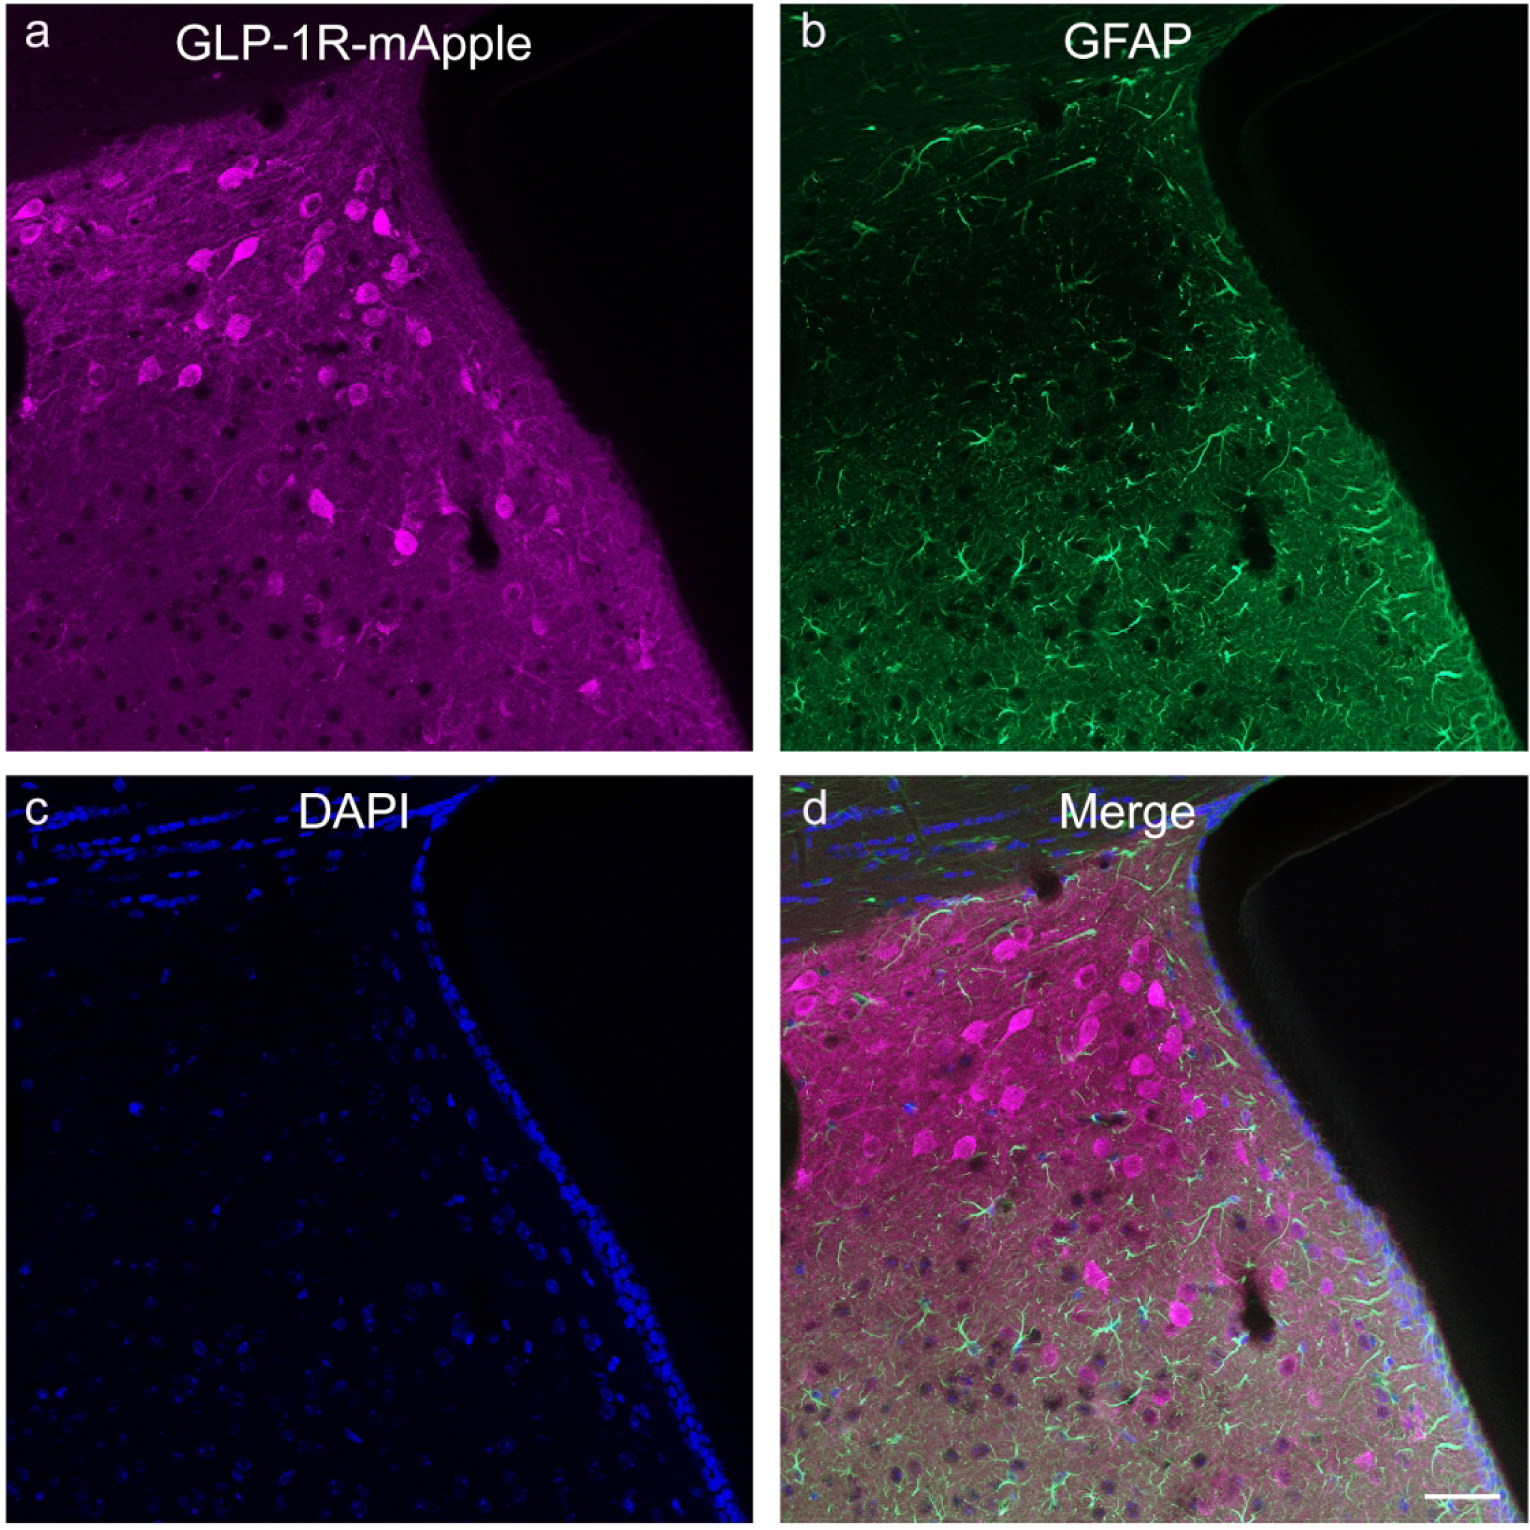
GLP-1R-mApple (a) was not expressed in GFAP+ cells (b), as depicted in the LS (d). DAPI is presented in blue (c). 20X magnification, 50 μm scale bar.
Official websites use .gov
A
.gov website belongs to an official
government organization in the United States.
Secure .gov websites use HTTPS
A lock (
) or https:// means you've safely
connected to the .gov website. Share sensitive
information only on official, secure websites.
GLP-1R-mApple (a) was not expressed in GFAP+ cells (b), as depicted in the LS (d). DAPI is presented in blue (c). 20X magnification, 50 μm scale bar.