Fig. 7.

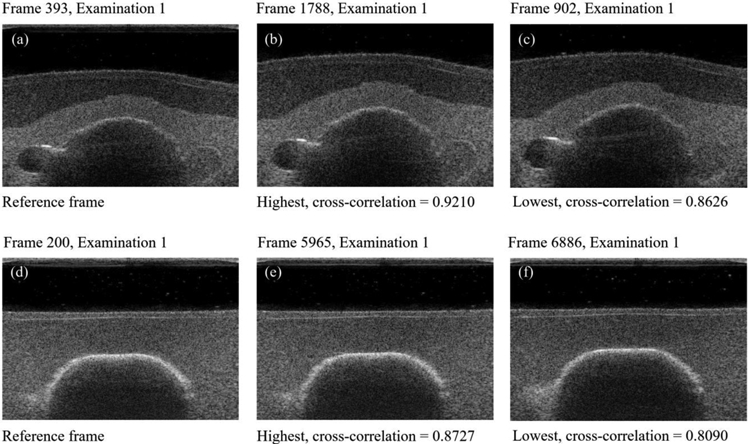
Selected reference frames (a, d) and their corresponding nearest neighbors having highest (b, e) and lowest (c, f) cross-correlation values. Rows show the best (top row) and the worst correlation result in the sequence (bottom row).

Selected reference frames (a, d) and their corresponding nearest neighbors having highest (b, e) and lowest (c, f) cross-correlation values. Rows show the best (top row) and the worst correlation result in the sequence (bottom row).