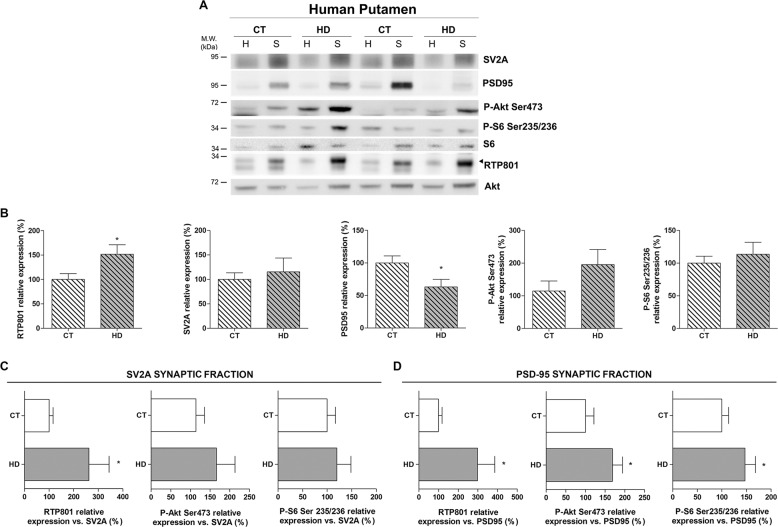
Fig. 2. RTP801 is increased in the synaptic fraction derived from the putamen of HD patients.
a, b Putamen of six HD patients and five control individuals homogenates (H) and synaptosomes (S) were subjected to WB. Membranes were probed against RTP801, SV2A, PSD-95, P-Akt (Ser473), P-S6 (Ser235/236), total S6 and total Akt was used as a loading control. Graphs show the densitometric quantification of synaptosomal levels. c, d Graphs indicate the levels of RTP801, P-Akt (Ser473) and P-S6 (235/236) relative to synaptic markers c SV2A and d PSD-95 in the synaptosomes. The results are shown as mean ± SEM. Data were analyzed by Student’s t-test or Mann–Whitney test (for Fig. 2b SV2a) (*P < 0.05).

