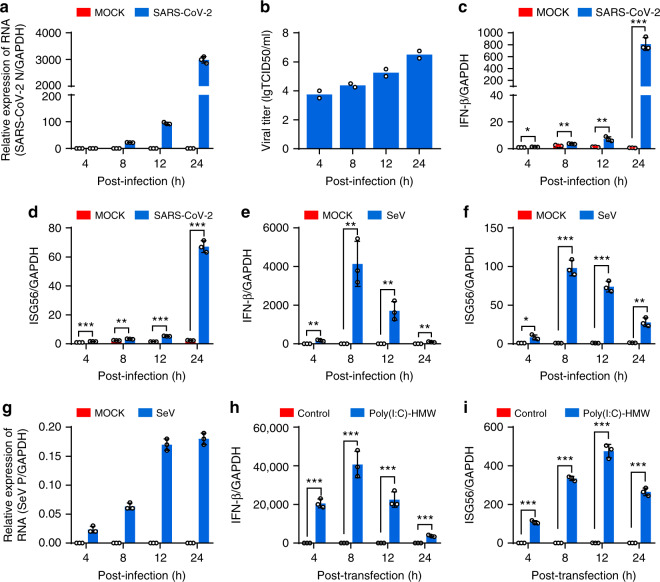
Fig. 1. SARS-CoV-2 infection induces the expression of antiviral genes.
a Calu-3 cells were mock-infected or infected with SARS-CoV-2 at an MOI of 0.5. At 4, 8, 12, and 24 h after infection, total RNA extracted from cells was evaluated by quantitative real-time PCR (qRT-PCR) using SYBR green method. The data are expressed as fold changes of the RNA levels of the viral N gene relative to the GAPDH control. b Calu-3 cells were mock-infected or infected with SARS-CoV-2 at an MOI of 0.5. At 4, 8, 12, and 24 h after infection, supernatants were collected, and viral titers were detected by using TCID50 assay. c, d Cells from a were collected, and total RNA extracted from the cells was evaluated by qRT-PCR using SYBR green method. The data are expressed as fold change of the IFNB mRNA c and ISG56 mRNA d levels relative to the GAPDH control. e–g Calu-3 cells were mock-infected or infected with Sendai virus. Cells were harvested and analyzed as described in c and d. h, i Calu-3 cells were transfected with high molecular weight poly(I:C) (poly(I:C)-HMW). Cells were harvested at indicated times and analyzed by qRT-PCR. All experiments were done at least twice, and one representative is shown. Error bars indicate SD of technical triplicates. *P < 0.05, **P < 0.01, and ***P < 0.001, two-tailed Student’s t-test. Source data are provided as a Source Data file.

