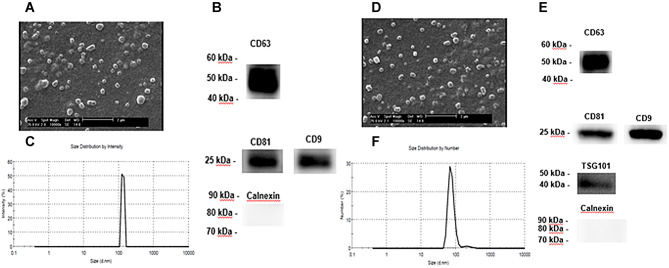
Fig. 3.
A–F Characterization of exosomes derived from PL and HHORSC. A, D SEM analysis of exosomes. Scale bars are 2 μm. B, E Nanoparticle analysis of HHORSC-Exo and PL-Exo. The mean diameter was 167 and 147 nm for HHORSC-Exo and PL-Exo, respectively. C, F Immunoblotting for CD63, CD81, CD9, TSG101 and Calnexin in exosomes

