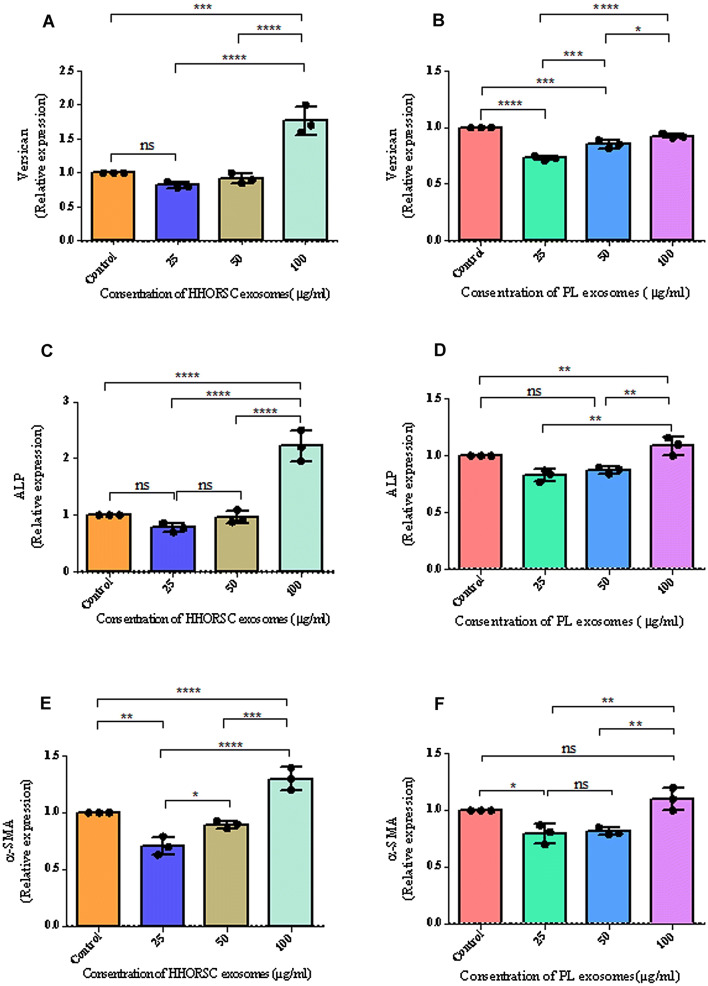
Fig. 7.
A–F Comparison of the versican (A, B), ALP (C, D) and α-SMA (E, F) relative mRNA expressions following different concentration of HHORSCs and PL exosomes treatment. Different experimental groups such as 100, 50 and 25 μg/mL of HHORSCs -Exo or PL -Exo were incubated with hDPC for 48 h, respectively. Exosome-treated hDPC were subjected to qRT-PCR analysis and the expression of each gene was normalized against the expression in the cells cultured with serum (10%) were used as control group. All data are expressed as mean ± standard deviation (SD) from three replicates. *P < 0.05, **p < 0.01, *** < 0.005, **** < 0.0001

