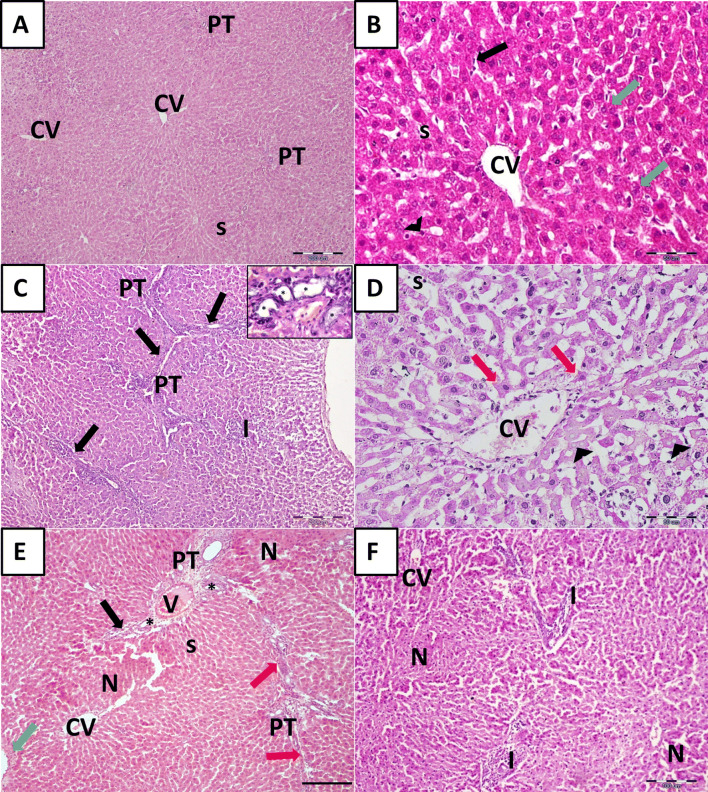
Fig. 4.
Histological assessment of the liver tissue of CCl4-treated animals. A, B Binucleated hepatocytes (green arrows). Sinusoids (s) are lined by endothelial cells (arrows) and Kupffer cells (arrowheads). C Liver fibrosis group (LFG). Fibrous tissue septa (arrows), mononuclear cellular infiltration (I). Inset: proliferated bile ducts (asterisks). D Liver fibrosis group (LFG). Hypereosinophilic hepatocytes (red arrows) and loss of nuclei (arrowheads). E, F Regression group (REG). Expansion of portal areas (black arrows), Porto-portal connective tissue septa (red arrow) and increased connective tissue deposition around central veins (green arrow). Note, the areas of hepatic necrosis (N), proliferated bile ducts (asterisks), sinusoids (s), cellular infiltration (I), portal tract (PT);central vein (CV). [H&E scale bar (A, C, E) 200 µm (B, D) 50 µm, and (F) 100 µm]

