Fig. 5.
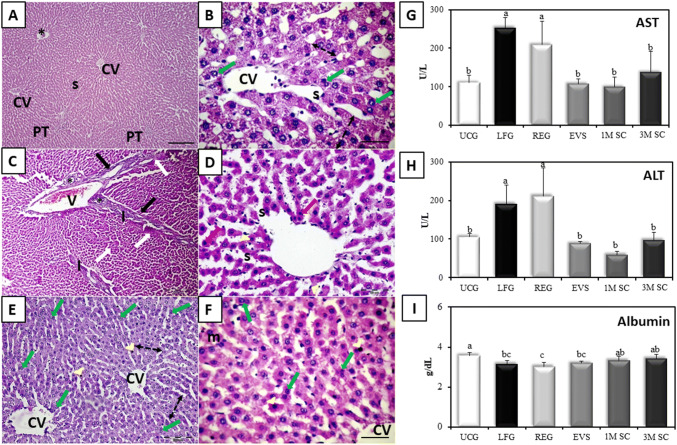
Impact of MSCs and EVs CCl4-induced liver fibrosis. A, B Liver tissue of EVs-treated group following induction of liver fibrosis (EVS). Binucleated hepatocytes (green arrows) S; dilated sinusoids.CV; central vein. H&E. Scale bars (A) 200 µm, (B) 50 µm. C, D Liver tissue of the 1M SC group. Portal vein (V), proliferated bile ducts (asterisks), periportal fibrous septa (arrows) with areas of periportal mononuclear cellular infiltration (I) and sporadic necrosis (red arrows), pyknotic nuclei (white arrows) dilated sinusoids (s) and proliferation of Kupffer cells (arrowheads). [H&E Scale bars (C) 200 µm, (D) 50 µm]. E, F The liver of rats that received 3 × 10⁶ MSCs (3M SC) increased cell plate thickness (double-headed arrows) and mitotic figure (m) in (F). Note, the few sporadic apoptotic cells (arrowheads). central vein (CV) [H&E Scale bars (E) 200 µm, (F) 50 µm]. G, H Serum AST and ALT levels (U/L) I Serum albumin levels (g/dL). Values represent mean ± SD (n = 6). Statistical significance was determined using ANOVA test, Pairwise comparison between each 2 groups was done using Post Hoc Test (Tukey). Similar letters indicate no statistical difference (p > 0.05), while different letters would indicate a true statistical difference (p < 0.05)

