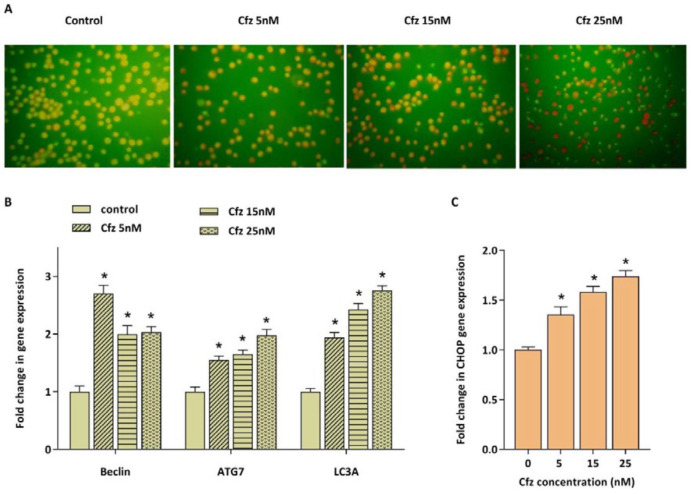
Figure 4.
The effect of Cfz on the induction of autophagy in Molt4 cells after 48 h of treatment. (A) Acridine orange staining of Molt4 cells after treatment with Cfz (5, 15 and 25 nM) was suggestive of the induction of autophagy. (B and C) The mRNA expression levels of beclin1, ATG7, LC3A and CHOP in Cfz-treated Molt4 cells. Values are shown as mean ± SD of three independent experiments. P-values ≤ 0.05 are indicated by asterisk and considered as statistically significant changes compared with control

