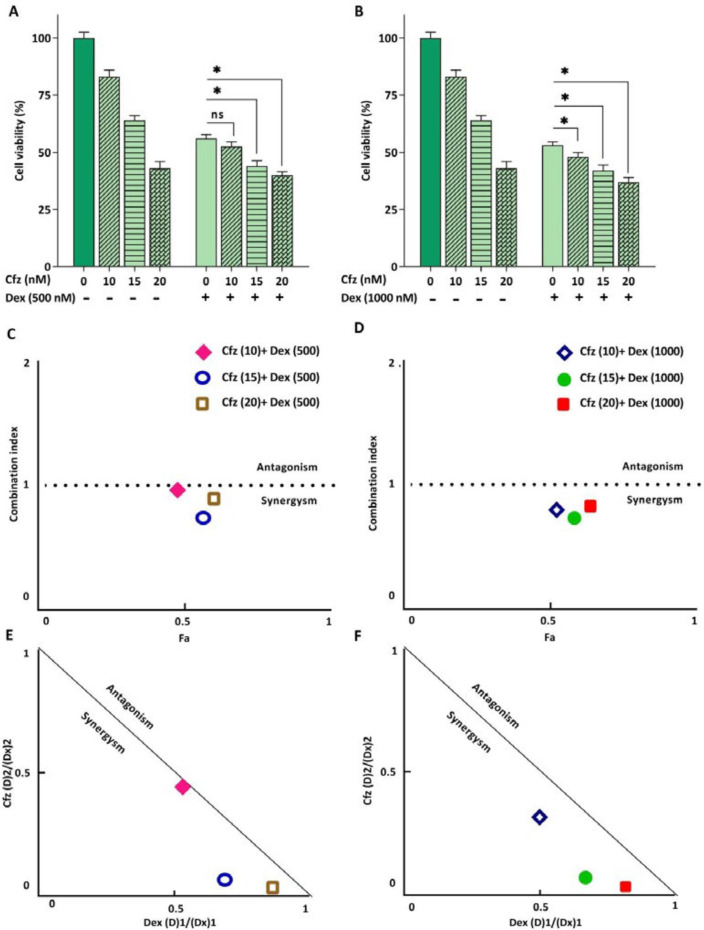
Figure 5.
(A and B) The effect of Cfz in combination with Dex on the metabolic activity of Molt4 cells after 48 h of treatment. (C and D) Combination index (CI) analysis of Dex and Cfz (E and F) and the normalized isobolograms. Values are shown as mean ± SD of three independent experiments. ns: not significant

