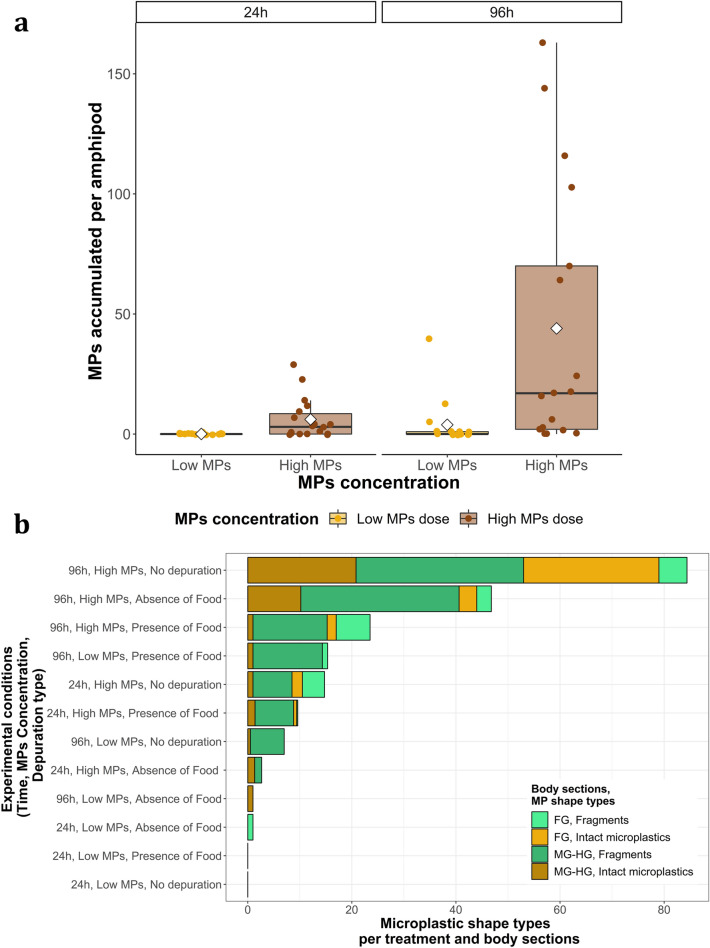
Figure 1.
Microplastic accumulation in G. duebeni digestive tracts under experimental conditions such as: time (24 h or 96 h exposure to plastics), microplastic concentration (Low MPs or High MPs) and depuration type (no depuration, 24 h depuration in presence or absence of food). Six replicates were run. All amphipods were exposed individually. (a) Shows the number of microplastics accumulated in G. duebeni for 24 and 96 h and for the two microplastic concentrations tested: low (600 microplastics/mL) or high 60,000 microplastics/mL). Here scatter data points represent each individual amphipod that had been exposed to microplastics (a total of 72) with its corresponding number of microplastics accumulated, including those amphipods with zero microplastics. Boxplots midline represents the median. White diamonds show the mean. Lower and higher limits of the boxes represent first Q1 and third Q3 quartiles (25th and 75th percentile). The upper whisker represents Q3 + (1.5 × IQR). IQR is the interquartile range. (b) Shows the average number of microplastics for each body section (“FG” stands for “Foregut” and “MG-HG” for “Midgut and Hindgut”) and microplastic shape type (intact microplastics or fragments). Here data is shown for all amphipods within each treatment, including those amphipods that had not accumulated particles. Both figures were produced using the “ggplot2” package in R (v3.4.3).

