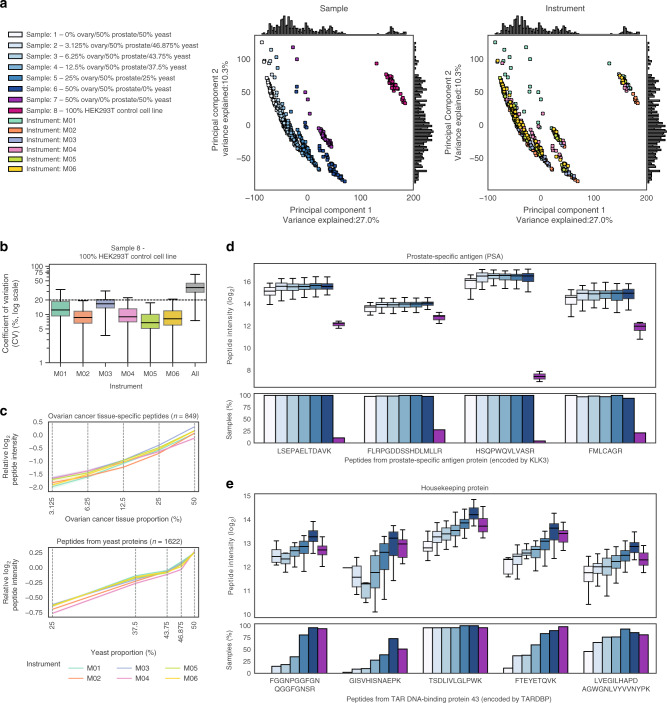
Fig. 2. Baseline DIA-MS data reproducibility.
Data shown in all plots were acquired during the experimental week after instrument cleaning (days 101, 103, 105 and 107) and were not normalised. a Principal component analysis of log2-transformed experimental data, with data points coloured by sample (left) and instrument (right). Missing values were filled with zeros. b Coefficient of variation (CV) per instrument in the HEK293T control cell line (Sample 8). CV was calculated using frequently observed peptides (n = 2950 peptides). A black dashed line marks a CV of 20% for reference. c Relative log2-transformed intensities per sample of ovarian cancer-tissue specific peptides (upper) and peptides from yeast proteins (lower), coloured by instrument. The mean peptide intensity from each sample was adjusted so that relative intensities are comparable, by dividing each value by the overall mean peptide intensity measured on a given instrument during the period. Ovarian cancer tissue and yeast proportions are plotted on the log2-scale. d, e Intensities of all peptides identified from d the prostate-specific antigen (PSA) protein encoded by KLK3 and e the housekeeping protein encoded by TARDBP. Boxplots show peptide intensity, with bar plots indicating the proportion of replicate samples in which each peptide was observed. Plots are coloured according to sample, using colour-codes as shown in a. For replicate numbers n, refer to Supplementary Data 2. In b, d and e, the box indicates quartiles and the whiskers indicate the rest of the distribution, with outliers not shown. Source data are provided as a Source data file.

