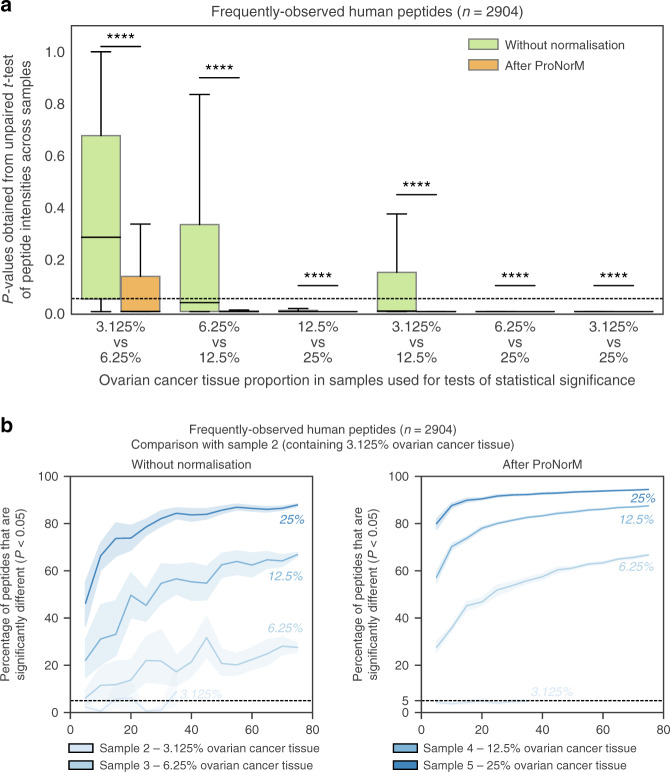
Fig. 5. Simulation of cohort analyses for discovery proteomics.
a Distribution of p-values obtained from unpaired two-sided t-test of intensities of frequently observed human peptides (n = 2904). Boxplots show p-values obtained when comparing samples containing the ovarian cancer tissue proportions indicated (ranging from 3.125% to 25%). Results are shown before normalisation (green) and after ProNorM (orange). The box indicates quartiles and the whiskers indicate the rest of the distribution, with outliers not shown. A black dashed line indicates a p-value of 0.05 and **** denotes P < 0.0001. b Percentage of frequently observed human peptides that were significantly different (vertical axis) in simulated cohorts of varying sizes (horizontal axis). Plots show comparison between Sample 2 (containing 3.125% ovarian cancer tissue) and Samples 2–5 (containing 3.125–25% ovarian cancer tissue), without normalisation (left) and after ProNorM (right). Shading denotes 95% confidence intervals derived from ten iterations of random selections of replicates of each sample. For statistical tests in both (a, b), the mean of each peptide was first calculated within each set of assigned technical triplicates. Source data are provided as a Source data file.

