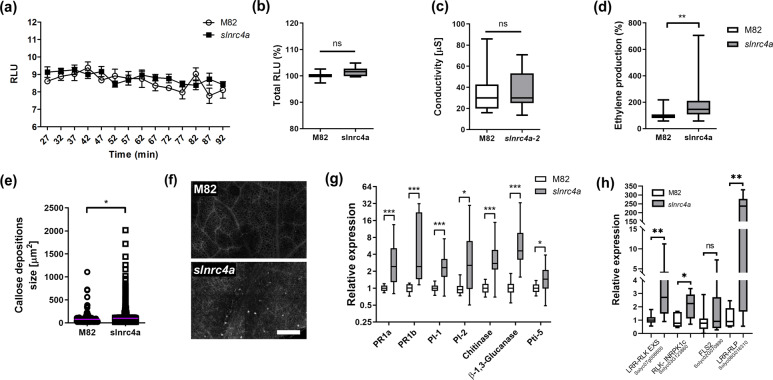
Fig. 2. slnrc4a gain of function mutant has elevated defense parameters in steady state condition.
a ROS production was measured every 5 min for 90 min in WT (cv M82) and slnrc4a line using the HRP-luminol method. Average ± SEM of four independent replicates is shown (two-way ANOVA, no significant difference). b Total ROS production presented in a. Average ± SEM of four independent replicates is shown (one-way ANOVA, no significant difference). c Conductivity levels of M82 and slnrc4a samples immersed in water for 24 h was measured. Average ± SEM of four independent replicates is shown (one-way ANOVA, no significant difference). d Ethylene production of M82 and slnrc4a samples was measured using gas chromatography. M82 average ethylene production is defined as 100%. Average ± SEM of five independent experiments is presented. Asterisks represent statistical significance in t-test with welch correction (**p-value < 0.01). e Callose deposition was observed by confocal microscopy after aniline blue staining of M82 and slnrc4a leaf discs. Callose deposit size was measured using the object counting tool of ImageJ. Average ± SEM of three independent replicates is shown, all individual values presented, line indicates mean. Asterisks represent statistical significance in t-test with welch correction (*p-value <0.05). f Callose deposition representative images. Scale bar = 200 µm. g Gene expression analysis of pathogen responsive genes in M82 and slnrc4a plants was measured by RT-qPCR. Relative expression normalized to M82. Average ± SEM of three independent replicates is shown. Asterisks represent statistical significance in t-test with welch correction comparing each gene (*p-value < 0.05; ***p-value < 0.001). h Gene expression analysis of PRR genes in M82 and slnrc4a plants was measured by RT-qPCR. Relative expression normalized to M82. Average ± SEM of three independent replicates is shown. Asterisks represent statistical significance in t-test with Welch’s correction comparing each gene (*p-value < 0.05; **p-value < 0.01). b–d, g, h Boxplots are shown with the inter-quartile-ranges (box), medians (black line in box) and outer quartile whiskers, minimum to maximum values.

