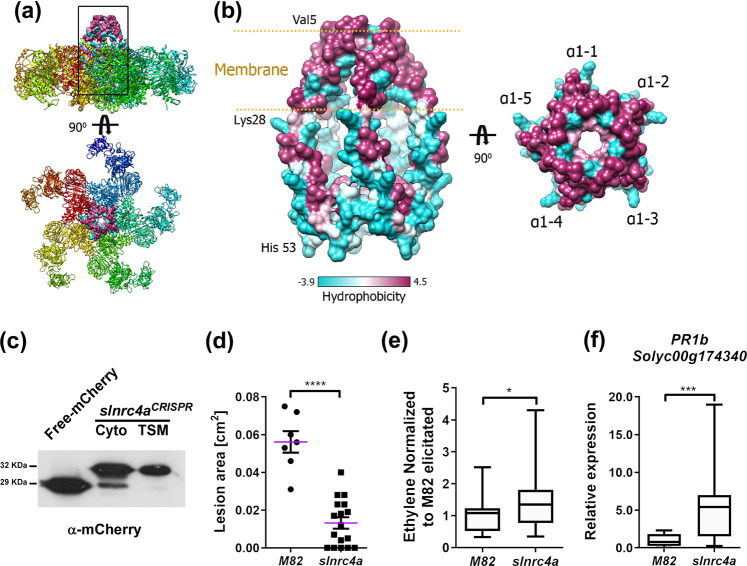
Fig. 7. slnrc4a can reside in the membrane and does not require PRR activation.
a The complex structure of ZAR1 (PDB:6J5T) represented as a ribbon in which each distinct color represents a different protein chain. The square box marks the position of the derived peptide in the surface representation. b Left, the modeled 3D assembly of SlNRC4a1–67 peptide based on the ZAR1 structure, in surface representation colored by hydrophobicity. The predicted membrane insertion site is marked by the two gold lines. Right, a top view of the SlNRC4a1–67 peptide structure with the marked five α1 helices (α1,1-5). c Biochemical protein fractionation of SlNRC4a1–67‐mCherry transiently expressed in N. benthamiana. Cytosolic (Cyto) or Triton X‐100 soluble membrane (TSM) protein fractions were subjected to SDS‐PAGE followed by α-mCherry immunoblot. Cytosolic fraction of free-mCherry transiently expressed in N. benthamiana is shown. d M82 and slnrc4a tomato lines were grown in-vitro for 3-weeks, leaves were inoculated with B. cinerea (10X6 spores/mL) and lesion area was measured after 3 days. Individual values are all presented line indicates mean. e Ethylene induction after EIX elicitation in M82 and slnrc4a samples was measured using gas chromatography. M82 average ethylene production after elicitation is defined as 1, average ± SEM is presented (NM82 = 17 and Nslnrc4a = 29). Asterisks represent statistical significance in t-test with welch correction (**p-value < 0.01). f M82 and slnrc4a tomato lines were grown in-vitro for 3-weeks and PR1b expression was measured by RT-qPCR in steady state conditions. Relative expression normalized to M82 (mock). For d, f 4–8 individuals were analyzed, average ± SEM is shown. Statistical significance in t-test with welch correction (***p-value < 0.001). e, f Boxplots are shown with inter-quartile-ranges (box), medians (black line in box) and outer quartile whiskers, minimum to maximum values.

