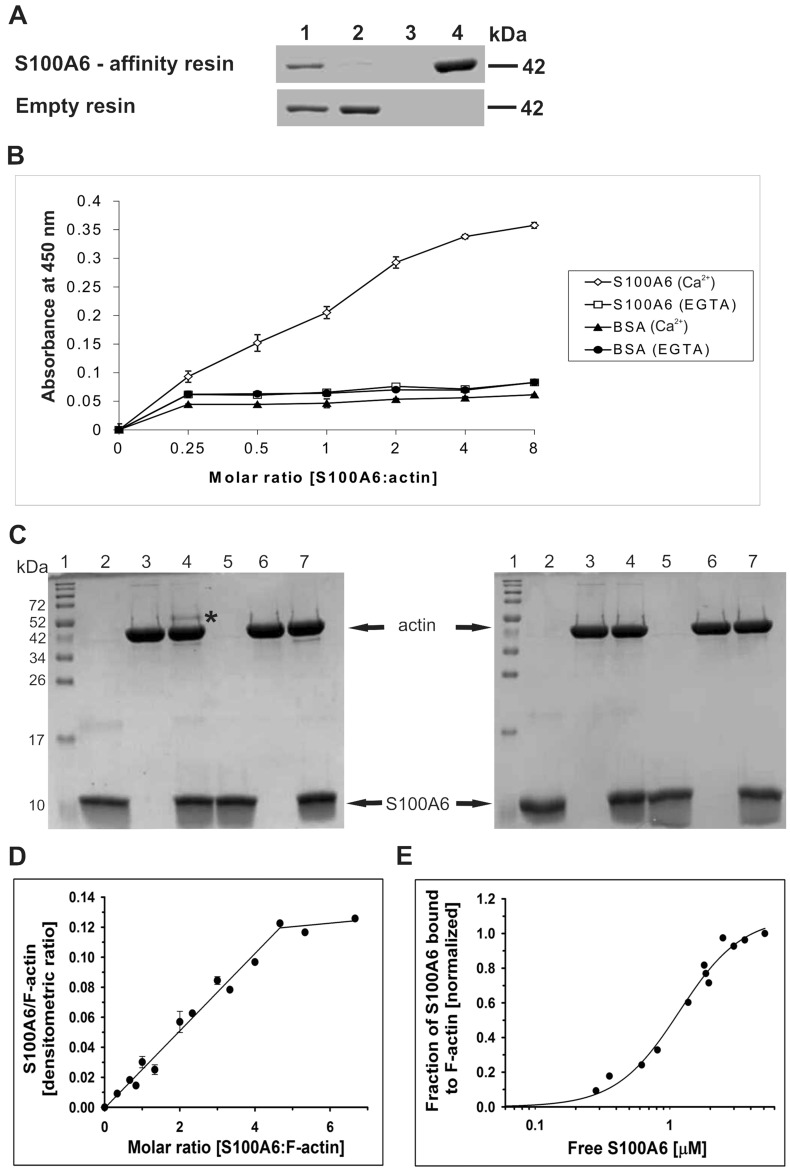
Figure 2.
Interaction of S100A6 with purified G-actin. (A) Pull-down assay performed with purified G-actin and with CNBr-Sepharose-S100A6 affinity resin (upper panel) or CNBr-Sepharose-empty resin (lower panel). Lanes: 1—input, 2—unbound fraction, 3—last wash, 4—elution. Fractions were analyzed by SDS-PAGE (10% gel) stained with Coomassie brilliant blue R250. (B) ELISA assay. The amount of S100A6 bound to G-actin was estimated using anti-S100A6 antibodies. The points represent mean absorbance values ± SD from 3 independent experiments. (C) Chemical cross-linking of S100A6 with G-actin analyzed by SDS-PAGE (15% gel) stained with Coomassie brilliant blue R250. Lanes 2 and 5—S100A6 alone, lanes 3 and 6—G-actin alone and lanes 4 and 7—mixture of S100A6 and G-actin. Proteins were incubated with EDC (lanes 2–4) or without this agent (lanes 5–7) in the presence of Ca2+ (left panel) or in their absence (right panel). Lanes no. 1 show the position of molecular weight standards (broad range, Bio-Rad). “*” indicates the S100A6–actin cross-linking product. (D) Saturation of F-actin with S100A6 analyzed by a co-sedimentation assay. S100A6:actin densitometric ratio drawn as a function S100A6:F-actin molar ratio. The experimental points were fit to linear regression. (E) Fractional saturation of F-actin with S100A6 as a function of unbound S100A6. The binding curve was obtained by fitting the experimental points to the Hill equation (Eq. 1). Analyzed data are from 3 independent experiments. Conditions: 3 μM F-actin, 0–20 μM S100A6, 10 mM Tris, pH, 7.5, 50 mM NaCl and 1 mM CaCl2.

