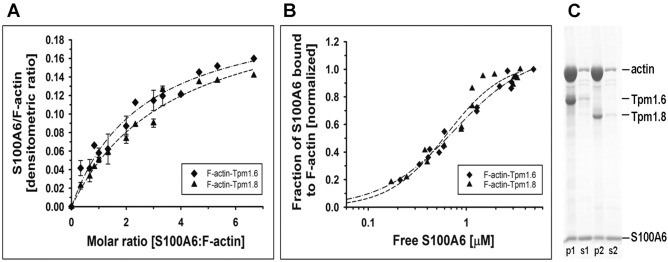
Figure 3.
Co-sedimentation of S100A6 with F-actin–tropomyosin complex. (A) Saturation of the F-actin–tropomyosin complex with S100A6 as a function S100A6:F-actin molar ratio. The experimental points were fit to hyperbolic equation. (B) Fractional saturation of F-actin with S100A6 shown as a function of unbound S100A6. The experimental points were fit to the Hill equation (Eq. 1). Conditions: 3 μM F-actin, 0.5 µM tropomyosin, 0–20 µM S100A6, 10 mM Tris, pH, 7.5, 50 mM NaCl and 1 mM CaCl2. The data are from 3 independent experiments. (C) Proteins collected in pellets (p) and supernatants (s) at saturation point, separated in SDS-PAGE (12% gel). 3 μM F-actin saturated with either 0.5 µM Tpm1.6 (p1, s1) or 0.5 µM Tpm1.8 (p2, s2) and 14 µM S100A6.

