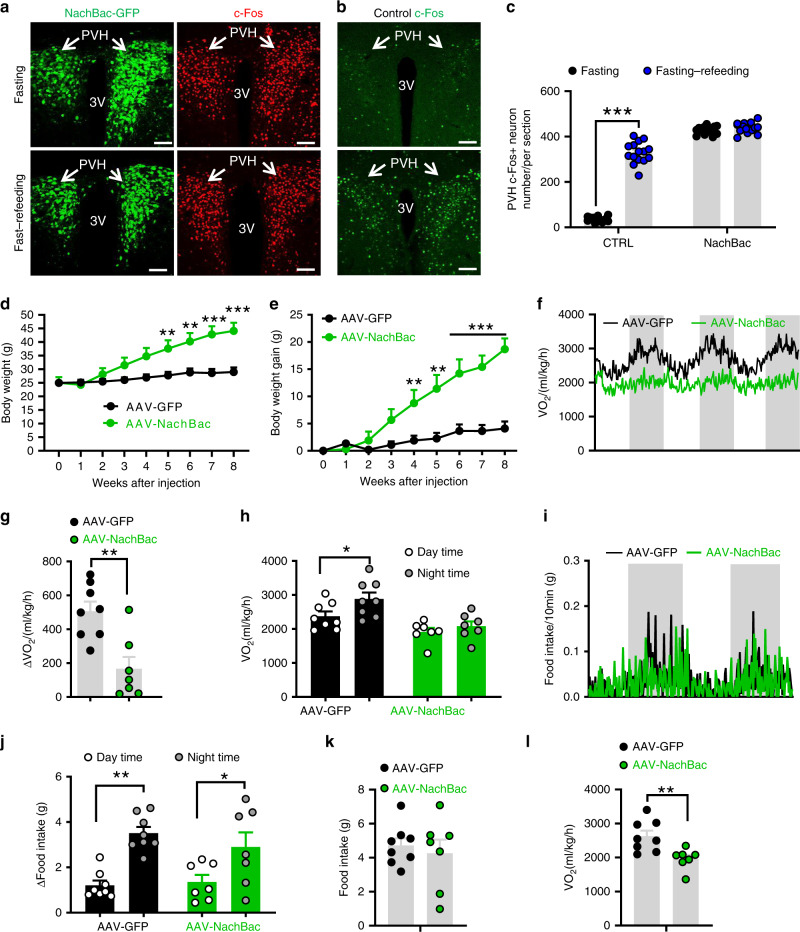
Fig. 3. Clamping PVH neuron activity at a high lever disrupted diurnal metabolism and caused obesity.
Sim1-Cre mice (8–10 weeks old) received injections of AAV-FLEX-GFP or AAV-EF1a-FLEX-EGFP-P2A-mNachBac vectors to bilateral PVH and used for studies. a, b Expression of EGFP in the PVH after the NachBac virus expression (a, left panels), and representative expression of c-Fos expression in the PVH after overnight fast alone (top panels) or overnight fast with 2 h refeeding (bottom panels) in NachBac mice (a, right panels) and control (b). c Comparison of number of neurons with c-Fos expression in the PVH between fast and fast–refeeding in control and NachBac mice (two-way ANOVA, n = 15/each, F(1, 56) = 385.3, ***p < 0.0001 Control fasting vs refeeding and p = 0.7212 NachBac fasting vs refeeding). At least three mice with five sections containing the PVH were used for counting the number of c-Fos in the PVH. Arrows point to the PVH proper. d–h Weekly body weight (d, two-way ANOVA, n = 8 for GFP and 7 for NachBac, F(8, 117) = 4.252, ***p < 0.0001, body weight at 8 weeks after injection between Control and NachBac), weekly net body gain (e, two-way ANOVA, n = 8 for GFP and 7 for NachBac, F(8, 171) = 7.256, ***p < 0.0001, body weight at 8 weeks after injection between Control and NachBac) were followed, real time traces showing energy expenditure (f), comparison in the difference of energy expenditure between day and night (g, unpaired two-tailed Student’s t-test, n = 8 for GFP and 7 for NachBac, t = 3.836, d.f. = 13, **p = 0.0021), and differences between day and night periods within groups (h, two-way ANOVA, n = 8 for GFP and 7 for NachBac, F(3, 26) = 9.314, *p = 0.0488 control GFP day vs night and p = 0.8657, NachBac day vs night). i, j Real time traces showing feeding (i) and comparison in the difference of feeding between day and night (j, two-way ANOVA, n = 8 for GFP and 7 for NachBac, F(3, 26) = 9.257, ***p = 0.0008 Control GFP day vs night, and *p = 0.0458 NachBac day vs night). j–l Daily feeding (k) and energy expenditure (l, unpaired two-tailed Student’s t-test, n = 8 for GFP and 7 for NachBac, t = 3.240, d.f. = 13, **p = 0.0064) were compared between groups. PVH paraventricular hypothalamus, 3V the third ventricle. Scale bar = 200 µM. All data presented as mean ± SEM. Source data are provided as a Source Data file.

