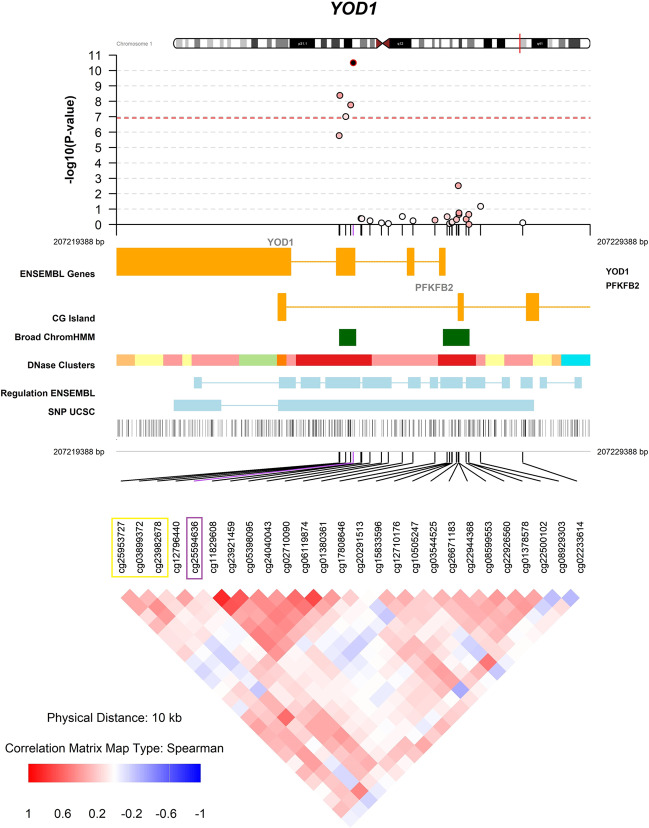
Fig. 2. Fine mapping of the association between DNA methylation in YOD1 and MDD.
EWAS results of the association between CpG sites and MDD adjusted for age at death, sex, PMI, neuron proportions and the first three principal components from the genotype data. The most significant CpG site (cg25594636) is marked in purple. The three CpG sites marked in yellow belong to a DMR (p value = 5.06 × 10⁻¹⁰, Table S3). The y axis indicates the strength of association in terms of negative logarithm of the association P value. Each circle represents a CpG site. Red dashed line within the graph indicates the genome-wide significance threshold (Bonferroni threshold: 1.22 × 10−07). The regulatory information and correlation matrix of other CpG sites in the region with the top hit are shown below the x axis. Color intensity marks the strength of the correlation and color indicates the direction of the correlation.

