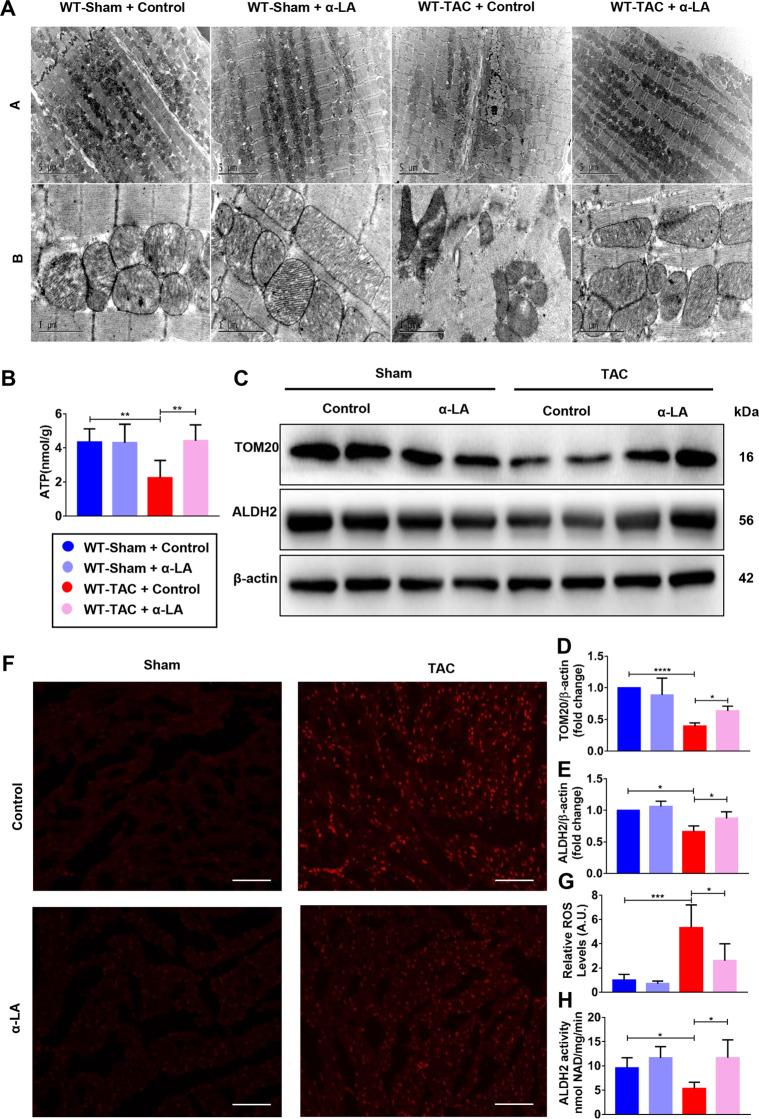
Fig. 3. α-LA reduces TAC-induced mitochondrial dysfunction and increases ALDH2 activity and expression.
a Transmission electron microscopy (TEM) images of left ventricular, Up: scale bar = 5 μm, down: scale bar = 1 μm; b quantitative analysis of ATP production of left ventricular; c–e Western blots of TOM20, ALDH2, and β-actin (loading control) and quantitative analysis of expressions of TOM20/β-actin, ALDH2/β-actin (n = 6 mice per group); f dihydroethidium (DHE, 200×, scale bar = 50 μm) staining; g quantitative analysis of myocardial ROS levels (n = 6 mice per group); h quantitative analysis of myocardial ALDH2 activity (n = 6 mice per group). Mean ± SEM, *P < 0.05, **P < 0.01, ***P < 0.001. Statistical analysis was carried out by a one-way ANOVA analysis followed by Tukey’s test for post hoc analysis.

