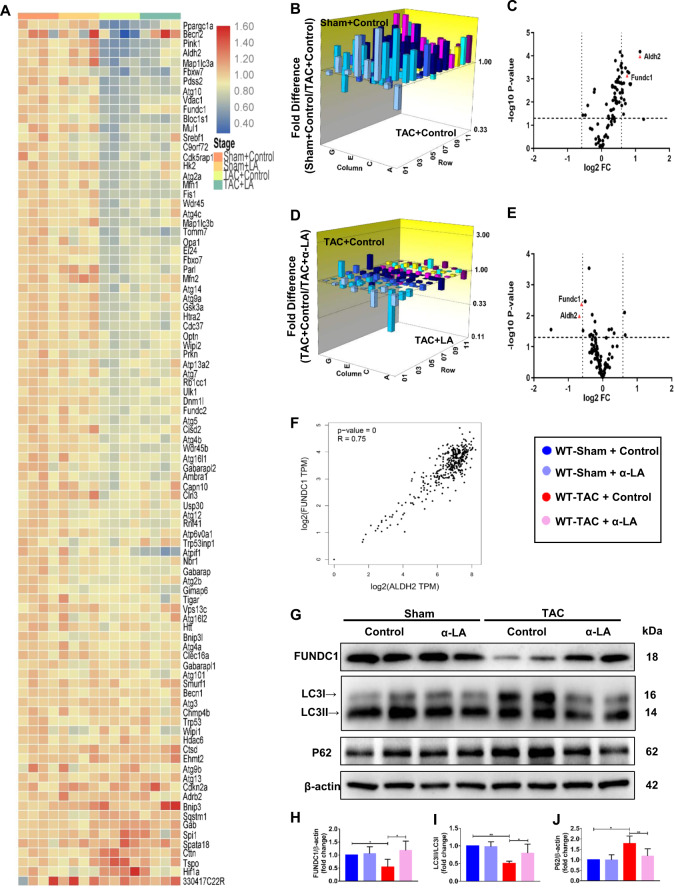
Fig. 4. FUNDC1 modulates α-LA effects in TAC-induced heart failure model.
a Heatmap of different groups in mRNA array; b three-dimensional diagram of mitophagy related genes when compared Sham+Control group with TAC + Control group; c volcano plot graphs of mPCR array. Graph shows the log2 of fold change of ALDH2 and FUNDC1 gene expression between Sham+Control group and TAC + Control group versus P value from the t test; d three-dimensional diagram of mitophagy related genes expression when compared TAC + Control group with TAC + LA group; e volcano plot graphs of mPCR array. Graph shows the log2 of fold change of ALDH2 and FUNDC1 gene expression between TAC + Control group and TAC + LA group versus P value from the t test; f correlation between FUNDC1 and ALDH2 expression in GTEx database; g Western blots of FUNDC1, LC3, P62, and β-actin (loading control); h–j quantitative analysis of expressions of FUNDC1/β-actin, LC3II/LC3I, P62/β-actin (n = 6 mice per group). Mean ± SEM, *P < 0.05, **P < 0.01. Statistical analysis was carried out by a two-tailed Student’s t test or one-way ANOVA analysis followed by Tukey’s test for post hoc analysis.

