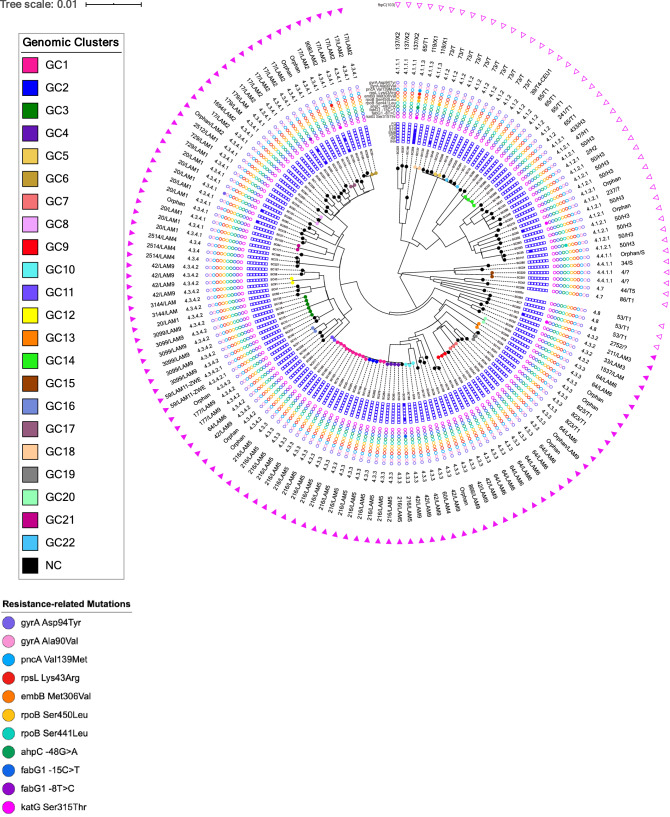
Figure 1.
Maximum likelihood phylogenetic tree for the 151 M.tb isolates included in the study. This tree was constructed based on 17,027 core SNPs and is shown annotated with (from the outside to the inside): presence or absence of fbpC103 LAM marker; SIT and spoligotyping clade; SNP-based sub-lineage; drug resistance associated mutations; and genotypic-based prediction for drug susceptibility. Tips are shown coloured according to the genomic cluster (see legend). NC not clustered, GC genomic cluster.

